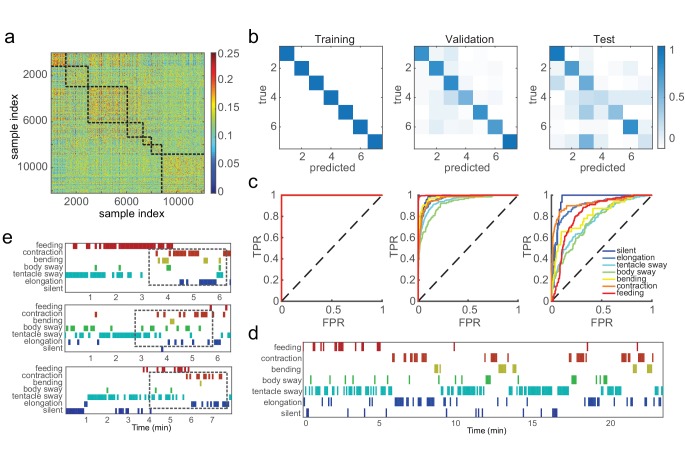
Figure 3. SVM classifiers recognize pre-defined Hydra behavior types.
(a) Pairwise Euclidean similarity matrix of extracted Fisher vectors. Similarity values are indicated by color code. (b) Confusion matrices of trained classifiers predicting training, validation, and test data. Each column of the matrix represents the number in a predicted class; each row represents the number in a true class. Numbers are color coded as color bar indicates. (Training: n = 50, randomly selected 90% samples; validation: n = 50, randomly selected 10% samples; test: n = 3) (c) ROC curves of trained classifiers predicting training, validation and test data. TPR, true positive rate; FPR, false positive rate. Dashed lines represent chance level. (d) An example of predicted ethogram using the trained classifiers. (e) Three examples of SVM classification of somersaulting behaviors. Dashed boxes indicate the core bending and flipping events.

