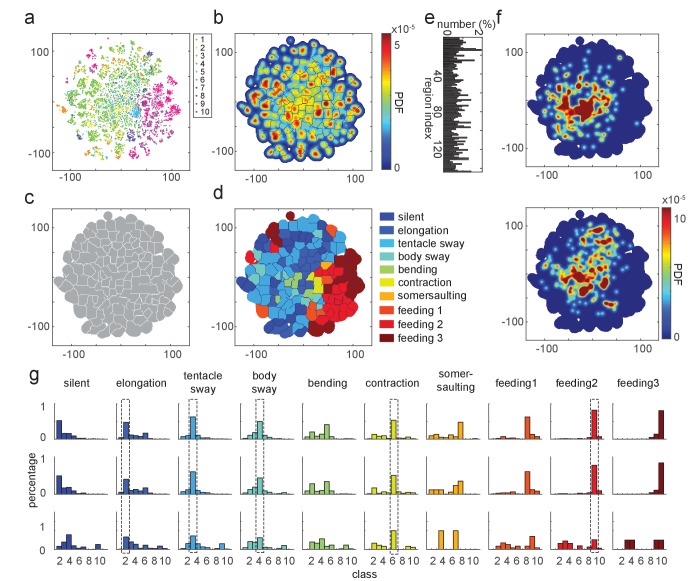
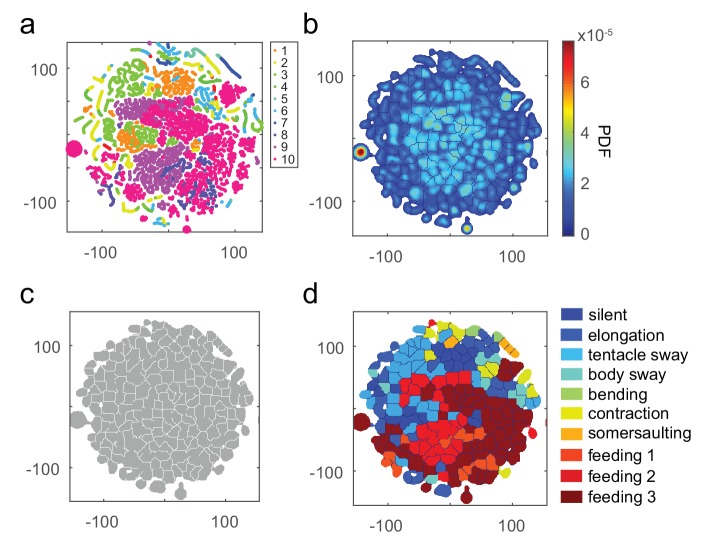
Figure 4. t-SNE embedding map of behavior types.
(a) Scatter plot with embedded Fisher vectors. Each dot represents projection from a high-dimensional Fisher vector to its equivalent in the embedding space. Color represents the manual label of each dot. (b) Segmented density map generated from the embedding scatter plot. (c) Behavior motif regions defined using the segmented density map. (d) Labeled behavior regions. Color represents the corresponding behavior type of each region. (e) Percentage of the number of samples in each segmented region. (f) Two examples of embedded behavior density maps from test Hydra polyps that were not involved in generating the codebooks or generating the embedding space. (g) Quantification of manual label distribution in training, validation and test datasets. Dashed boxes highlight the behavior types that were robustly recognized in all the three datasets. Feeding 1, the tentacle writhing or the first stage of feeding behavior; feeding 2, the ball formation or the second stage of feeding behavior; feeding 3, the mouth opening or the last stage of feeding behavior.


