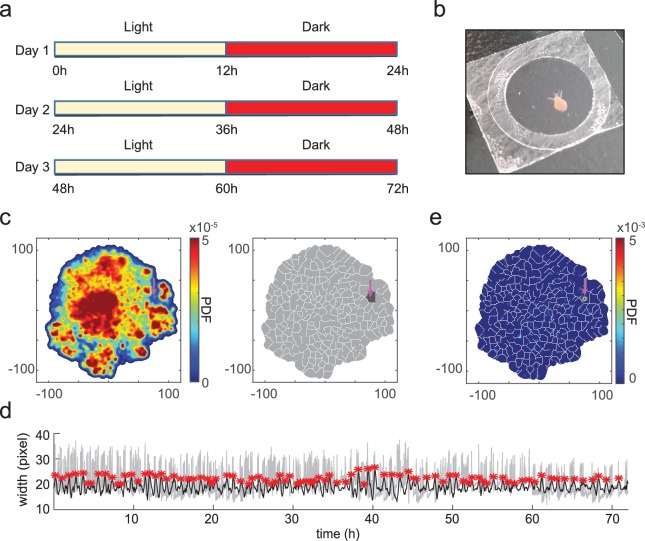
Figure 5. t-SNE embedding reveals unannotated egestion behavior.
(a) Experimental design. A Hydra polyp was imaged for 3 days and nights, with a 12 hr light/12 hr dark cycle. (b) A Hydra polyp was imaged between two glass coverslips separated by a 100 µm spacer. (c) Left: density map of embedded behavior during the 3-day imaging. Right: segmented behavior regions with the density map. Magenta arrow indicates the behavior region with discovered egestion behavior. (d) Identification of egestion behavior using width profile. Width of the Hydra polyp (gray trace) was detected by fitting the body column of the animal to an ellipse, and measuring the minor axis length of the ellipse. The width trace was then filtered by subtracting a 15-minute mean width after each time point from a 15-minute mean width before each time point (black trace). Peaks (red stars) were then detected as estimated time points of egestion events (Materials and methods). (e) Density of detected egestion behaviors in the embedding space. Magenta arrow indicates the high density region that correspond to the egestion region discovered in c.

