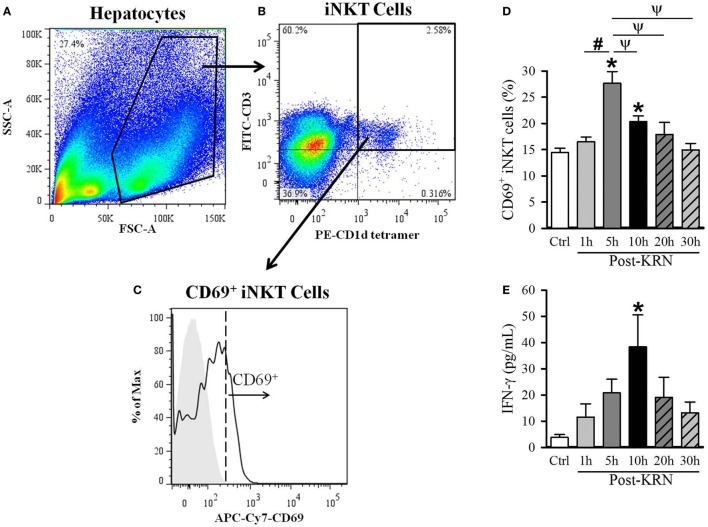
Figure 2.
Kinetic analysis of KRN treatment on hepatic invariant natural killer T (iNKT) cell activation in neonatal mice. Serum and liver from C57BL/6 pups received KRN (0.2 µg/g BW) intraperitoneal were harvested at 1, 5, 10, 20, and 30 h after KRN administration or sham. Liver was dissociated through a 70-µm strainer to isolate hepatocytes, followed by staining and flow cytometry analysis. A representative sample showing flow cytometry gating strategy is shown. (A) Total cells isolated from the liver were gated for the live lymphocyte population based on forward scatter (FSC) and side scatter (SSC) characteristics. (B) The iNKT cell population was then identified by gating for the FITC-CD3 and PE-CD1d tetramer double-positive cell population. (C) Flow cytometric analysis of surface CD69 expression on the gated hepatic iNKT cells. Shaded area indicates negative control. (D) Flow cytometric analysis of surface CD69 expression on gated hepatic iNKT cells at each time point. (E) Interferon (IFN)-γ levels in the serum were measured by enzyme-linked immunosorbent assay at each time point. Data expressed as mean ± SEM (n = 6–16 per group) and compared by one-way analysis of variance (*p < 0.05 vs. Ctrl, #p < 0.05 vs. 1 h, ψp < 0.05 vs. 5 h).

