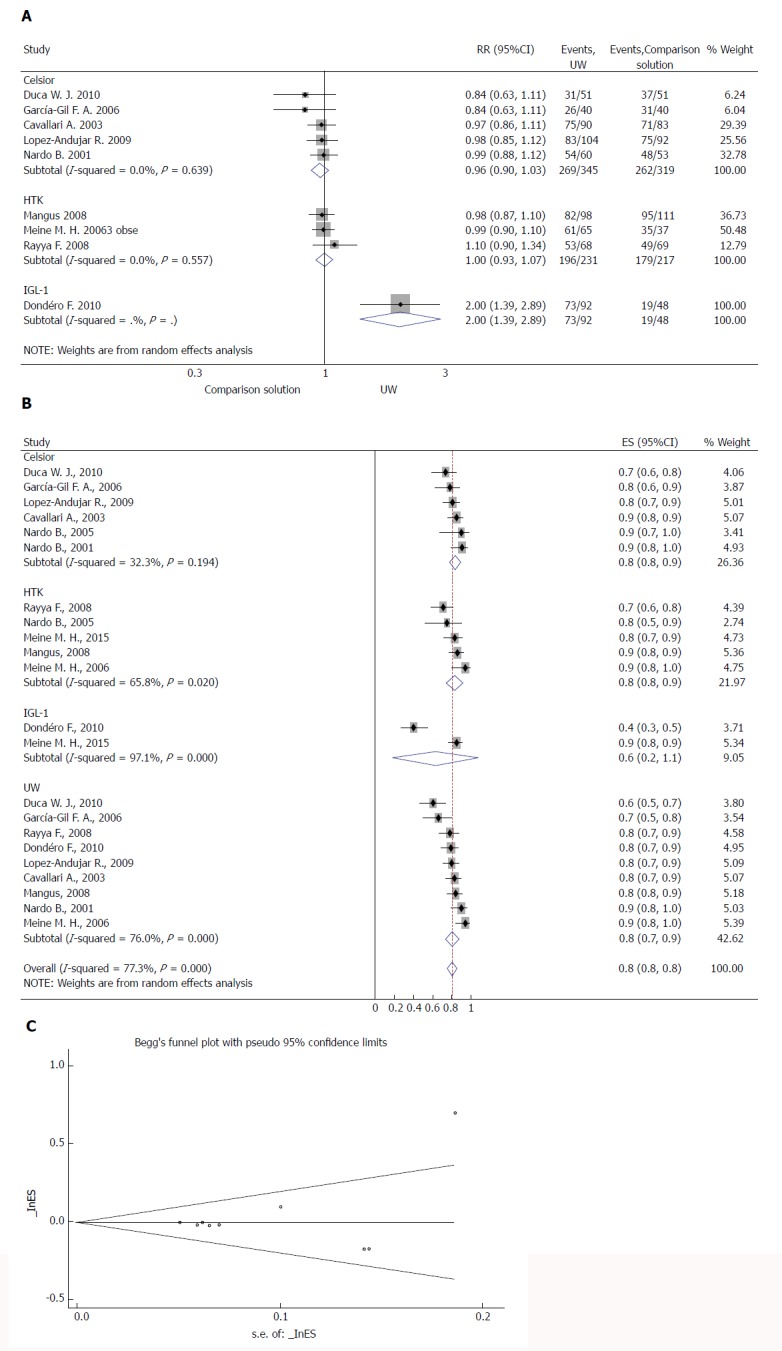
Figure 3.

Effects of preservation solutions on one-year post-transplant graft survival. A: Meta-analysis of the relative risk (-RR-) of OGS-1 comparing studies using different preservation solutions: UW vs Celsior and UW vs HTK; B: Forest plot for subgroup analysis of OGS-1; and C: Funnel plot for OGS-1 in studies. Squares represent individual study effects, with the size of the box relating to the weight of the study in the meta-analysis. Each diamond represents a summary effect from meta-analysis. Horizontal bars represent 95% CIs. There is no evidence of a small study effect in the test or the formal plot. OGS-1: One-year post-transplant graft survival; RR: Relative risk; RCTs: Randomized controlled trials; ES: Effect size; UW: University of Wisconsin solution; HTK: Histidine-tryptophan-ketoglutarate solution; CS: Celsior solution; IGL-1: Institut Georges Lopez solution.
