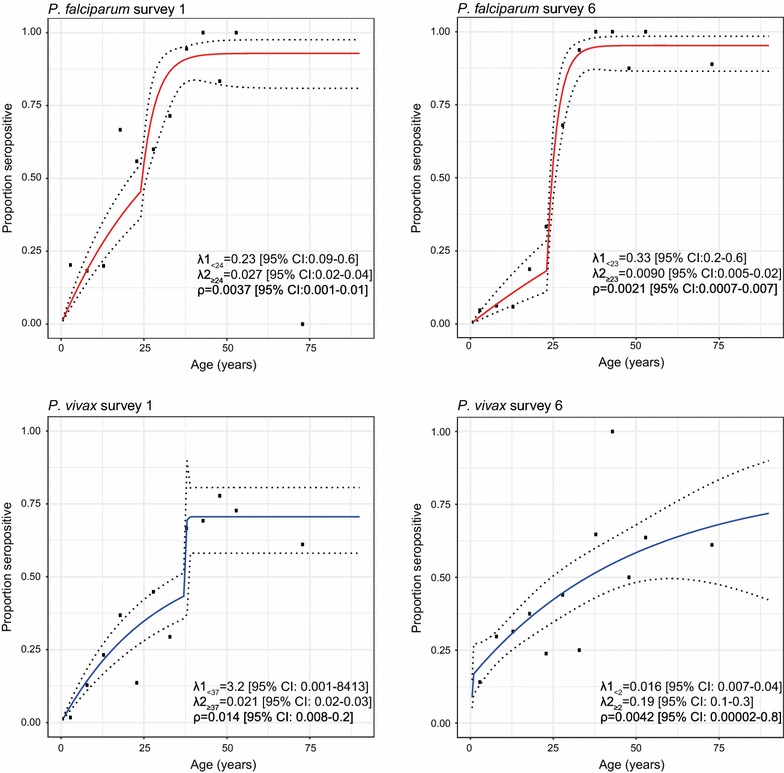
Fig. 5.

Reversible catalytic model of Plasmodium falciparum (red) and Plasmodium vivax (blue) seroprevalence versus age in individuals participating at survey 1 and at survey 6 using two seroconversion rates (λ) and seroreversion rate (ρ) estimated at maximum likelihood. Dots represents calculated seroprevalence in 5-years age groups for ages up to 55, and one average for all ages above 55 and are plotted at the median age of the age group
