
Fig. 2.
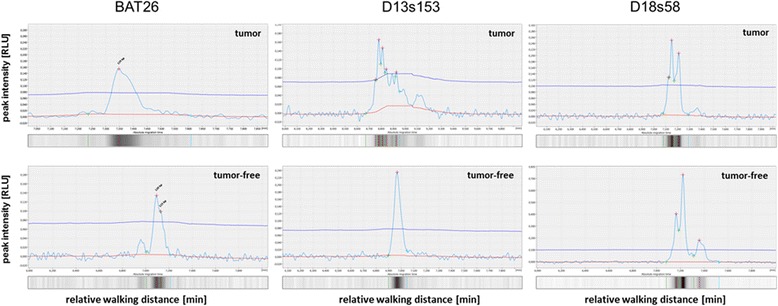
Electropherograms and virtual gel lanes obtained for BAT26, D13s153, and D18s58. The panel shows tumor (top) vs. tumor-free tissue (bottom) of different Patients with unstable microsatellites (MSI)
Official websites use .gov
A
.gov website belongs to an official
government organization in the United States.
Secure .gov websites use HTTPS
A lock (
) or https:// means you've safely
connected to the .gov website. Share sensitive
information only on official, secure websites.
Electropherograms and virtual gel lanes obtained for BAT26, D13s153, and D18s58. The panel shows tumor (top) vs. tumor-free tissue (bottom) of different Patients with unstable microsatellites (MSI)