
Fig. 3.
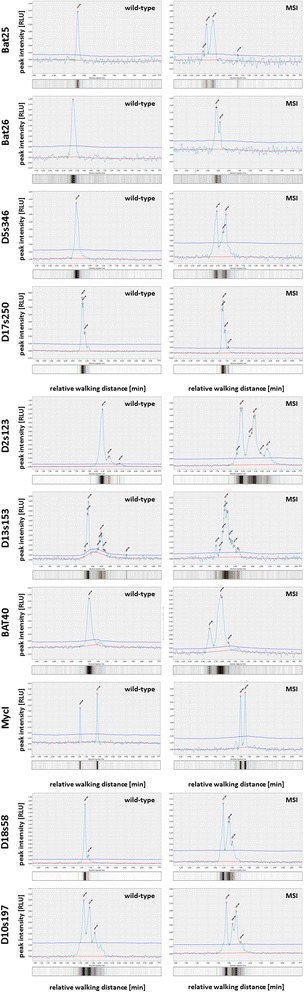
Electropherograms and virtual gel lanes exemplarily shown for all 10 microsatellites included in the protocol. For all microsatellites a tumor free specimen versus a tumor tissue is shown, thereby tumor and tumor free peaks shown for the respective marker originate from the same donor. The samples used in our study were considered positive if the peak pattern differed between tumor and tumor free tissue. Of note, we observed that the marker D17s250 may only differ slightly in the first peak in which a shift in the first double peak was observed that was less extensive as observed for the other markers. This phenomenon is visible if the figure is enlarged