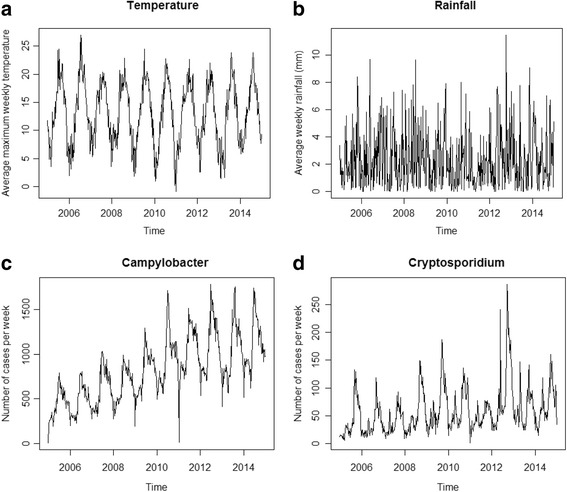
Fig. 1.

Time series of maximum temperature, average rainfall, Campylobacter and Cryptosporidium cases in England and Wales. Panels a, b, c and d show the average maximum temperature (°C) per week at laboratory postcodes, the average total rainfall (mm) per week at laboratory postcodes, the number of Campylobacter and Cryptosporidium cases per week from 01/01/2005 to 31/12/2014 in England and Wales
