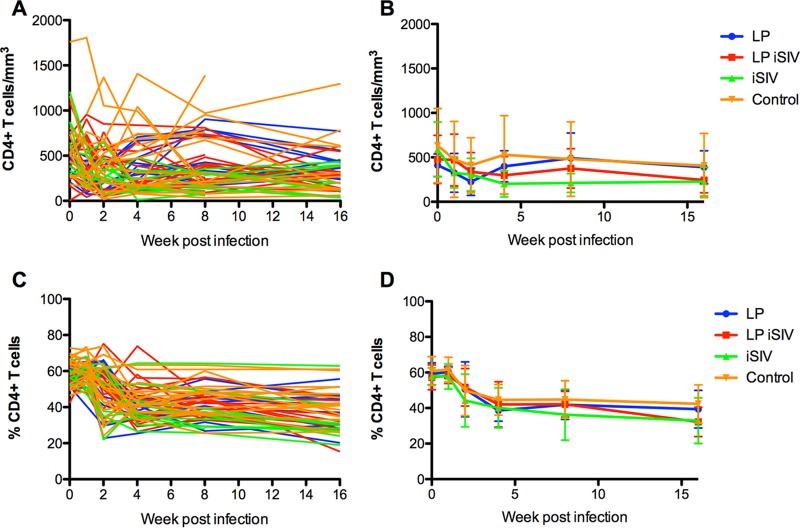
FIG 5.
CD4 counts (percentage and absolute, individual and groups). A longitudinal assessment of CD4+ T cell levels in peripheral blood was performed. (A) After SIV challenge, individual levels of CD4+ T cells in blood (expressed as numbers of cells per cubic millimeter) were calculated. (B) Average CD4+ T cell counts were calculated for each immunization group. (C and D) Individual and average frequencies of CD4+ T cells were tracked (expressed as percentages of CD3+ T cells). Error bars represent SD. The color scheme is as follows: blue, L. plantarum only; red, L. plantarum-iSIV; green, iSIV only; and orange, controls.

