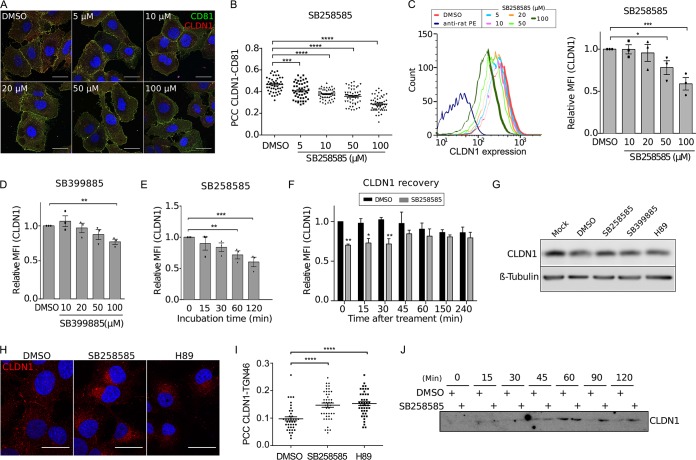
FIG 4.
SB258585 alters CLDN1 recycling, causing its intracellular accumulation. (A) Huh-7 cells were treated for 2 h with DMSO or increasing concentrations of SB258585. Cell surface expression of CD81 and CLDN1 was analyzed by immunofluorescence assay. Images were taken using a Zeiss LSM-880 microscope and a 63× objective. (B) Pearson correlation coefficients (PCCs) were calculated for cell surface ROIs for at least 40 different cells for each condition. (C) Huh-7 cells were treated for 2 h with DMSO or increasing concentrations of SB258585, and CLDN1 expression was analyzed by flow cytometry. Curves from a representative experiment are shown. Mean fluorescence intensities (MFI) relative to that for the DMSO-treated condition are also presented. (D) Huh-7 cells were treated for 2 h with DMSO or increasing concentrations of SB399885, and CLDN1 expression was analyzed by flow cytometry. (E) Huh-7 cells were incubated with SB258585 (100 μM) for the indicated periods. CLDN1 present at the cell surface was quantified by flow cytometry. (F) Huh-7 cells were treated for 2 h with SB258585 (100 μM). The drug was then removed and replaced by DMEM for the indicated times. Cytometry analyses were performed to quantify CLDN1 at the cell surface. For panels D to F, mean fluorescence intensities relative to those for the DMSO-treated condition are shown. (G) Huh-7 cells were treated for 2 h with DMSO, SB258585 (100 μM), SB399885 (100 μM), or H89 (10 μM). The total quantity of CLDN1 was assessed by Western blotting. β-Tubulin was used as a loading control. (H) Huh-7 cells were treated for 2 h with DMSO, SB258585 (100 μM), or H89 (10 μM). CLDN1 subcellular localization was determined by immunofluorescence assay after membrane permeabilization. Images were taken with a 63× objective. (I) TGN46 was stained concomitantly with CLDN1, and PCCs were calculated for intracellular CLDN1-TGN46 colocalization for >35 cells for each condition. (J) After surface biotinylation, Huh-7 cells were incubated at 37°C with DMSO or SB258585 (100 μM) for the indicated times. Biotin remaining at the cell surface was cleaved by use of glutathione. The amount of internalized CLDN1 was determined by Western blotting after pulldown of biotin-labeled proteins with streptavidin-agarose beads. A representative Western blot (n = 3) is presented. All results are presented as means ± SEM (n = 3). One-way ANOVA (B to E and I) or two-way ANOVA (F) followed by the Dunnett or Bonferroni posttest was performed for statistical analysis. *, P < 0.05; **, P < 0.01; ***, P < 0.001; ****, P < 0.001. Bars = 30 μm.

