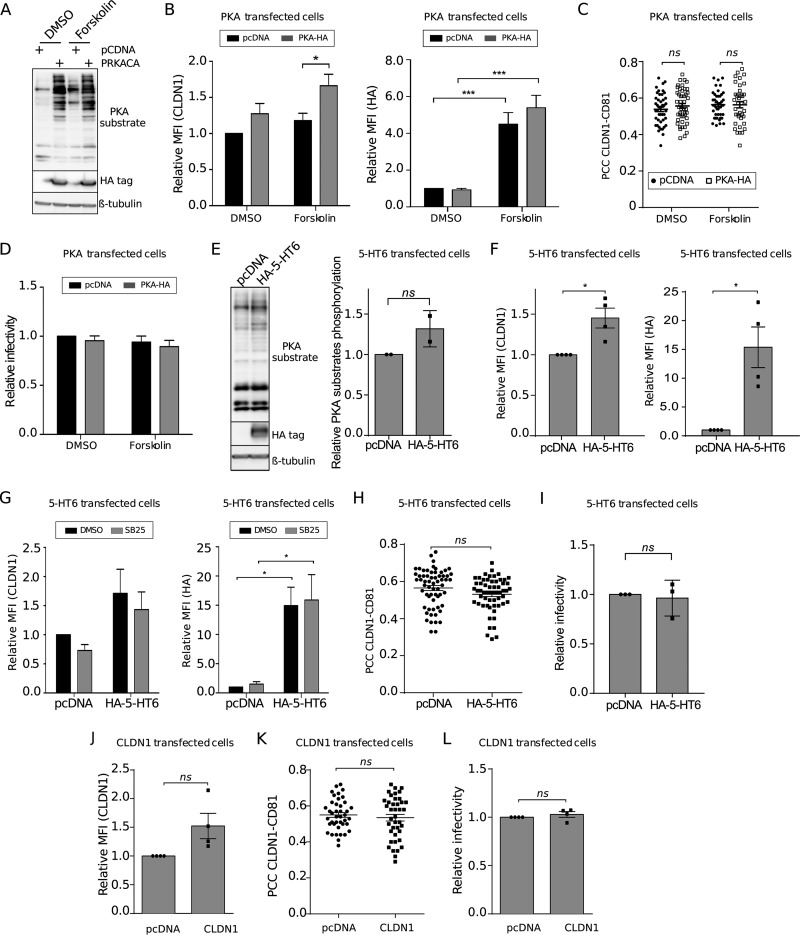
FIG 7.
PKA activation increases CLDN1 localization at the cell surface, without increasing HCV entry or CLDN1-CD81 colocalization. (A to D) Huh-7 cells were transfected with pcDNA or pcDNA-PRKACA for 48 h. Cells were treated for 2 h with DMSO or forskolin (20 μM), as indicated. (A) A representative Western blot (n = 3) is presented in order to show the phosphorylation of PKA substrates. β-Tubulin was used as a loading control, and PKA transfection was checked by HA immunoblotting. (B) Cytometry analysis was performed to quantify CLDN1 cell surface localization and PKA-HA transfection. Mean fluorescence intensities relative to that for the DMSO-treated condition are shown (n = 3). (C) CLDN1 and CD81 were analyzed by immunofluorescence assay, and PCCs were calculated after confocal image acquisition for cell surface ROIs for at least 40 different cells for each condition. (D) Transfected cells were treated for 2 h with DMSO or forskolin (20 μM), together with HCVcc infection. Infection was quantified at 30 h postinfection by immunofluorescence assay. (E to I) Huh-7 cells were transfected with pcDNA or pcDNA-5-HT6 for 48 h. (E) A representative Western blot (n = 2) and relative quantification of the total phosphorylation of PKA substrates normalized to the loading control (β-tubulin) are presented. HA–5-HT6 transfection was checked by HA immunoblotting. (F and G) Cell surface CLDN1 and HA–5-HT6 were immunolabeled and quantified by flow cytometry. Mean fluorescence intensities relative to that for the DMSO-treated condition are shown. For panel G, transfected Huh-7 cells were treated for 2 h with SB258585 (100 μM) before labeling for flow cytometry analyses. (H) CLDN1 and CD81 immunostaining followed by confocal microscopy allowed for the calculation of PCCs for cell surface ROIs for at least 40 different cells for each condition. (I) Transfected Huh-7 cells were infected with HCVcc for 2 h. Infection was quantified at 30 h postinfection by immunofluorescence assay. (J to L) Huh-7 cells were transfected with pcDNA or pcDNA-CLDN1 for 48 h. Cell surface CLDN1 was immunolabeled and quantified by flow cytometry. (J) Mean fluorescence intensities relative to that for the DMSO-treated condition are shown. (K) CLDN1 and CD81 immunostaining followed by confocal microscopy allowed for the calculation of PCCs for cell surface ROIs for at least 40 different cells for each condition. (L) Transfected cells were infected with HCVcc at 48 h posttransfection. Infection was quantified at 30 h postinfection by immunofluorescence assay. Results are presented as means ± SEM (n = 3 [C, D, H, and I] or n = 4 [B, F, G, and J to L] independent experiments). Two-tailed Student's t test (E, F, and H to L) or two-way ANOVA (B, D, and G) followed by the Bonferroni posttest was performed for statistical analysis. *, P < 0.05; ***, P < 0.001; ns, nonsignificant.

