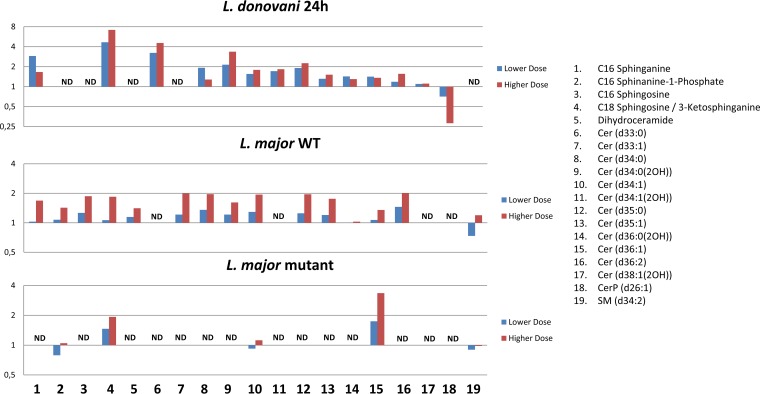
FIG 3.
Fold changes in abundance of all SLs detected in L. donovani axenic amastigotes and/or L. major promastigotes, comparing treated parasites to untreated parasites. Lower-dose and higher-dose data are shown for each, corresponding to 4.47 μM and 13.41 μM, respectively, for L. donovani and 10 μM and 30 μM, respectively, for L. major. SLs that were not detected in a certain data set are marked with ND, while X denotes complete absence in drug-treated parasites and presence in untreated parasites.

