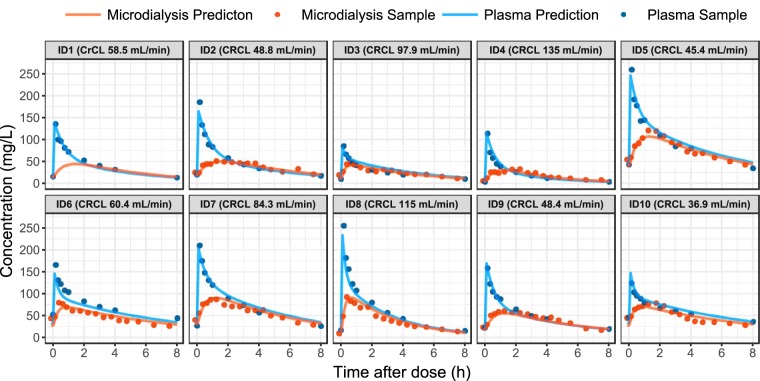
FIG 3.
Overview of the samples (points) available from the intensive sampling on day 1 for each of the 10 individuals (with assayed microdialysis concentrations plotted at the midpoint of the collection interval). The predictions from the model are shown for both plasma and subcutaneous adipose tissue concentrations (solid lines). Note that individuals five, seven, and eight were administered 2 g of meropenem per dose, and that the baseline creatinine clearance is given for each patient.

