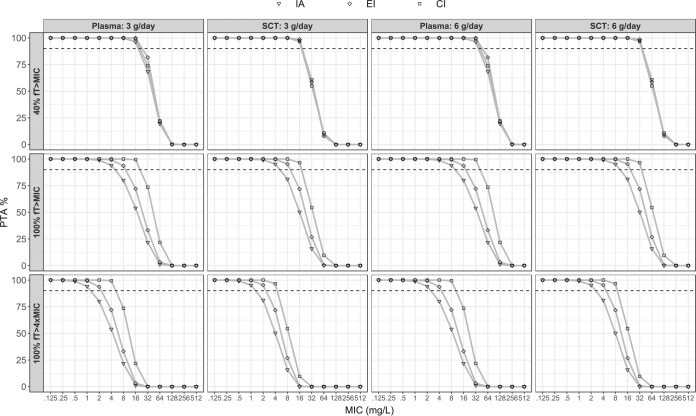
FIG 5.
Probability of target attainment (PTA) for each of the three regimens using the final model and a distribution of estimated creatinine clearance (eCLCr) values. The graph indicates the PTA following the administration of 3 or 6 g per day for both plasma and subcutaneous adipose tissue (SCT) for a range of MICs. The dashed line indicates a PTA of 90%. Abbreviations: CI, continuous infusion; EI, extended infusion; IA, intermittent administration.

