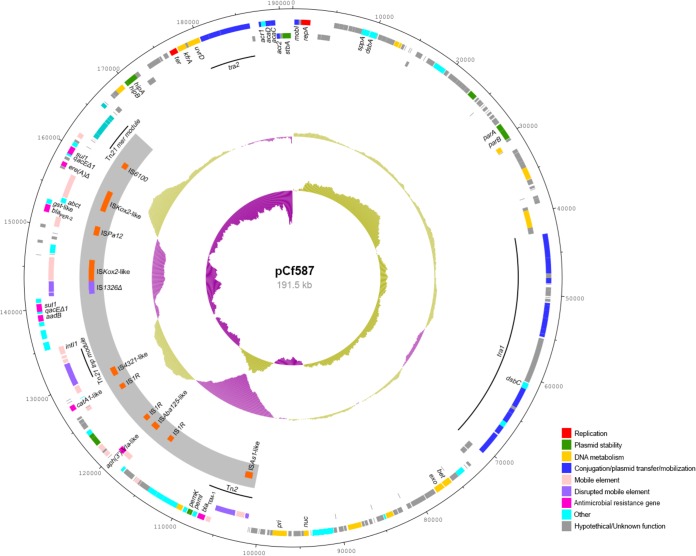
FIG 1.
Schematic representation of the genetic organization of pCf587. The two outer rings show the coding sequences on the forward and reverse strands of the plasmid. Each coding sequence is color coded according to its predicted function, as shown in the figure. The gray arc depicts the resistance island (RI-pCf), with the insertion sequences identified on the plasmid. The two inner rings represent the GC plot and the GC skew graph, respectively. For both plots, magenta and olive green indicate the measures below and above the average, respectively.

