FIG 3.
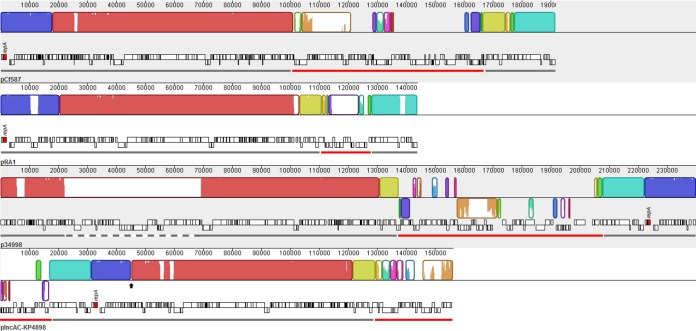
Local colinear block comparison between pCf587, pRA1, p34998, and pIncAC-KP4898 by Mauve software. Each local colinear block represents regions with homologous sequences without rearrangements. The same local colinear blocks are identified with the same color. Within each collinear block, the height of the similarity profile corresponds to the average level of conservation in that region. Gray and red lines indicate the plasmid backbone and the resistance islands, respectively. The dashed gray line indicates an insertion in the p34998 backbone. The black arrow indicates the position of a deletion in the pIncAC-KP4898 backbone. The repA gene of each plasmid is identified.

