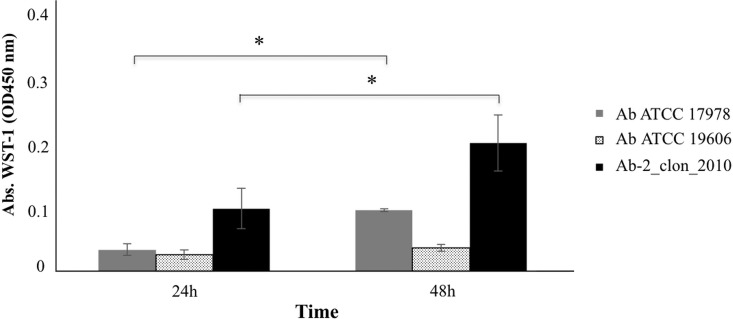
FIG 3.
Enzymatic activity by colorimetric assay (WST-1-based) of the isolates A. baumannii ATCC 17978, A. baumannii ATCC 19606, and A. baumannii Ab-2_clon_2010-CHLX in the presence of IMP and CHLX. The x axis represents absorbance (optical density at 450 nm [OD450]), and the y axis represents time (h). *, P < 0.05 (Student's t test).

