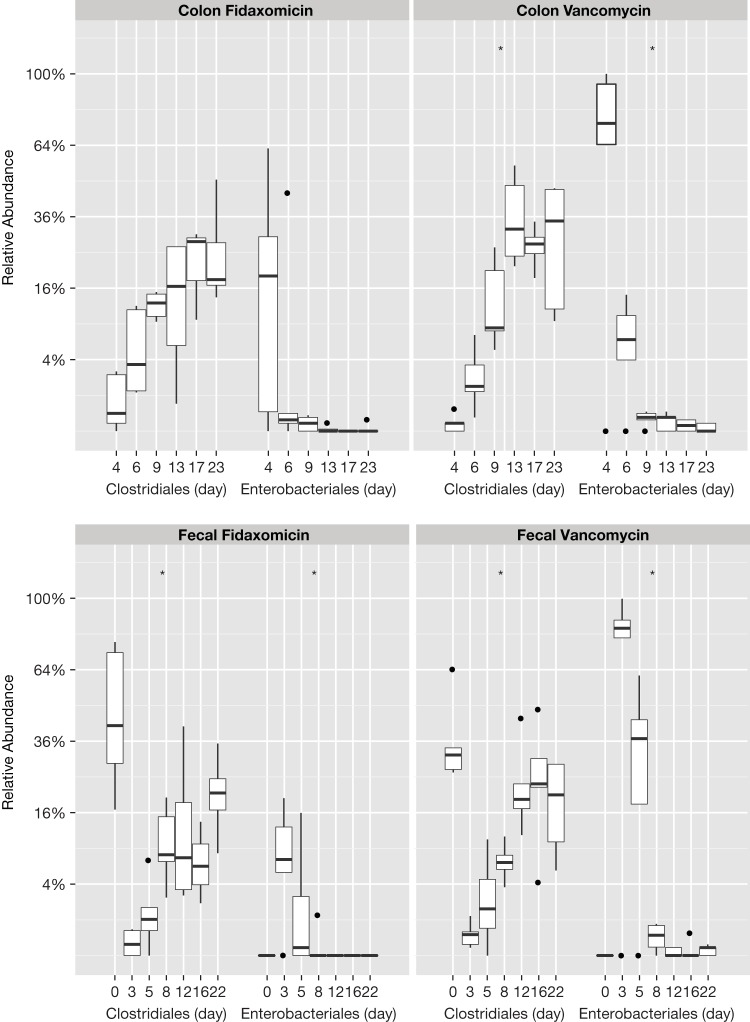
FIG 3.
Tukey box-and-whisker plot showing fecal and colon taxonomic abundance following antibiotic regimens. Boxes represent Q1/Q3 limits; whiskers are ±1.5 standard deviation (SD). Dots represent data points outside the ±1.5 standard deviation (SD), and the horizontal lines are the statistical medians.

