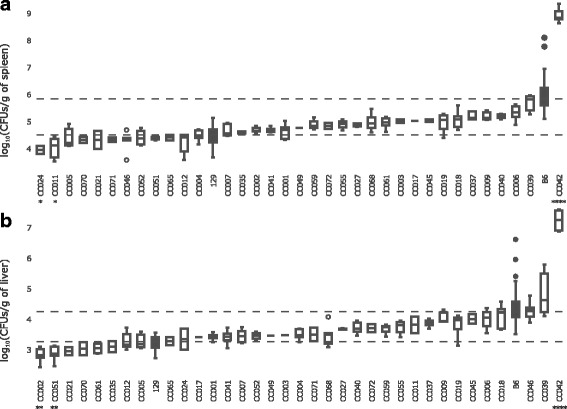
Fig. 1.

Bacterial loads in CC, B6 and 129 control strains at day 4 post-infection with Salmonella Typhimurium. Groups of 7–20 weeks old mice for 35 CC strains (open), B6 and 129 (closed), were inoculated with 103 CFUs of Salmonella Typhimurium strain SL1344, and euthanized 4 days after infection for organ bacterial load assessment. Results are presented as the log10(CFUs/g of tissue) in spleen (a) and in liver (b). Phenotype of each strain is shown as boxes and whisker plots. The bottom, medium and top band of boxes correspond to the first, second and third quartiles. Individual grey dots represent outlier animals. The minimum and maximum bacterial load values for each strain are represented by the ends of whiskers. Dashed lines indicate the median values of B6 (high) and 129 (low) reference strains. CC042 showed extremely high level of bacteria in both organs compared to B6 mice, while CC011/Unc and CC024/GeniUnc had 3 to 4-fold lower spleen CFU counts than 129 mice; CC002/Unc and CC051/TauUnc had 3-fold lower liver CFUs counts than 129 mice. Mean bacterial loads between extreme CC strains and control resistant or susceptible strains were compared by one-way ANOVA test. Asterisks indicate respective P-value of P < 0.1(*), P < 0.01 (**), P < 0.001 (***), P < 0.0001 (****)
