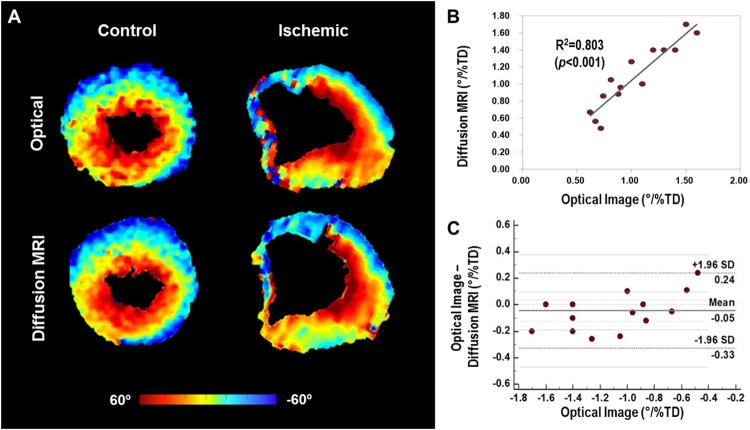
Figure 5.
Representative helix angle maps of control and ischemic mouse hearts from optical imaging and DTI. (A) Helix angle transmurality of the control and ischemic groups revealed significant reduction in overall helical structure in diseased tissue (DTI: 0.79 ± 0.13°/% transmural depth [TD] and optical imaging: 0.84 ± 0.26°/%TD), compared with control tissue (DTI: 1.31 ± 0.20°/% TD and optical imaging: 1.36 ± 0.27°/%TD), specifically in the endocardium (all p < 0.001). (B) Linear correlation analysis demonstrating significant correlation (R2 = 0.803) between DTI and optical images. (C) Bland-Altman plot demonstrating similarity between the optical imaging-based and DTI-based cardiomyocytes helix angle transmurality estimation (Bland-Altman limits of agreement, −0.33 to 0.24°/% transmural depth [TD]).

