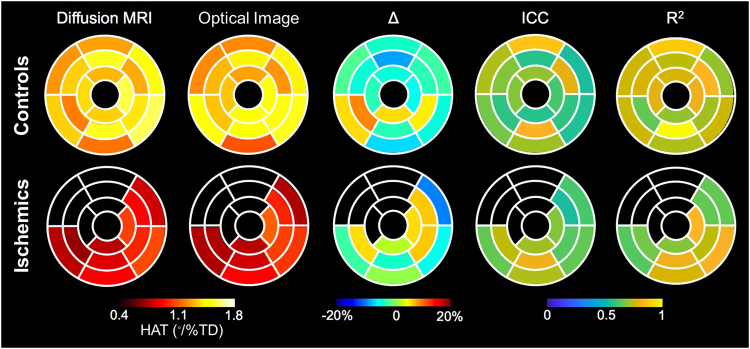
Figure 6.
Comparison of segmental analysis between DTI and optical images in controls (upper) and ischemic group (lower). From the left, helix angle transmurality (HAT) of each 16-segments calculated in DTI, segmental HAT by optical image, differences (∆) between HAT in DTI and optical images, intraclass correlation (ICC) between DTI and optical images, and correlation coefficient (R2) between two measurements. Overall, DTI exhibited good segmental correlation with optical images in both controls and ischemic hearts.

