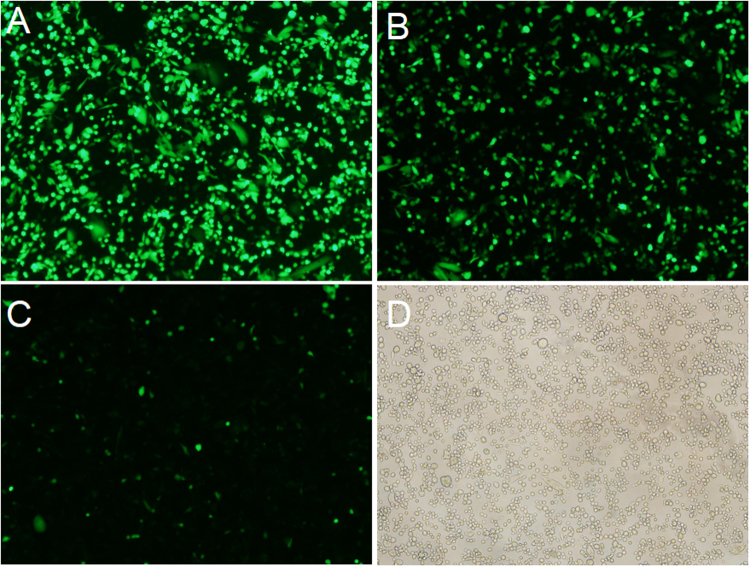
Figure 2.
Fluorescence profile of EGFP in CHO-S cells. CHO-S cells transfected with vectors containing IRES elements from different resources were measured using FACS after 48 h transfection. (A) Representative of high EGFP fluorescence profile in cells with the pIRES-EGFP-9. (B) Representative of medium EGFP fluorescence profile in cells with the pIRES-EGFP-4. (C) Representative of low EGFP fluorescence profile in cells with the pIRES-EGFP-2. (D) Representative of untransfected cells. Scale bar, 100 μm.

