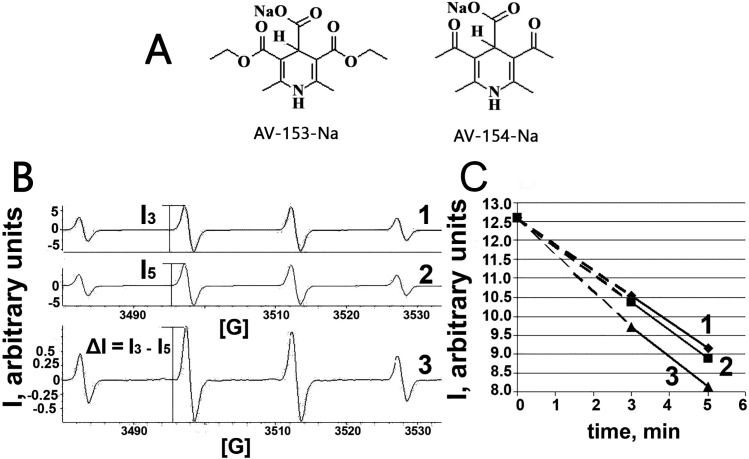
Figure 1. Electron paramagnetic resonance spectroscopy.
(A) Chemical structures of AV-153 –Na and AV-154. (B) EPR spectra of DMPO-OH radicals generated in Fenton reaction in presence of DMPO. 1—EPR spectra of DMPO-OH radicals 3 min after mixing the components for Fenton reaction. 2—EPR spectra of DMPO-OH radicals 5 min after mixing the components for Fenton reaction. I3 and I5—intensities of EPR signals used for quantification of DMPO-OH radicals in corresponding time. 3—difference between 3 min and 5 min spectra indicating decrease of the signal intensity and lack of generation of other radicals. (C)—time course of decrease of intensity of DMPO-OH radical spectra. 1—control mixture; 2—in presence of AV-154-Na; 3—in presence of AV-153-Na.

