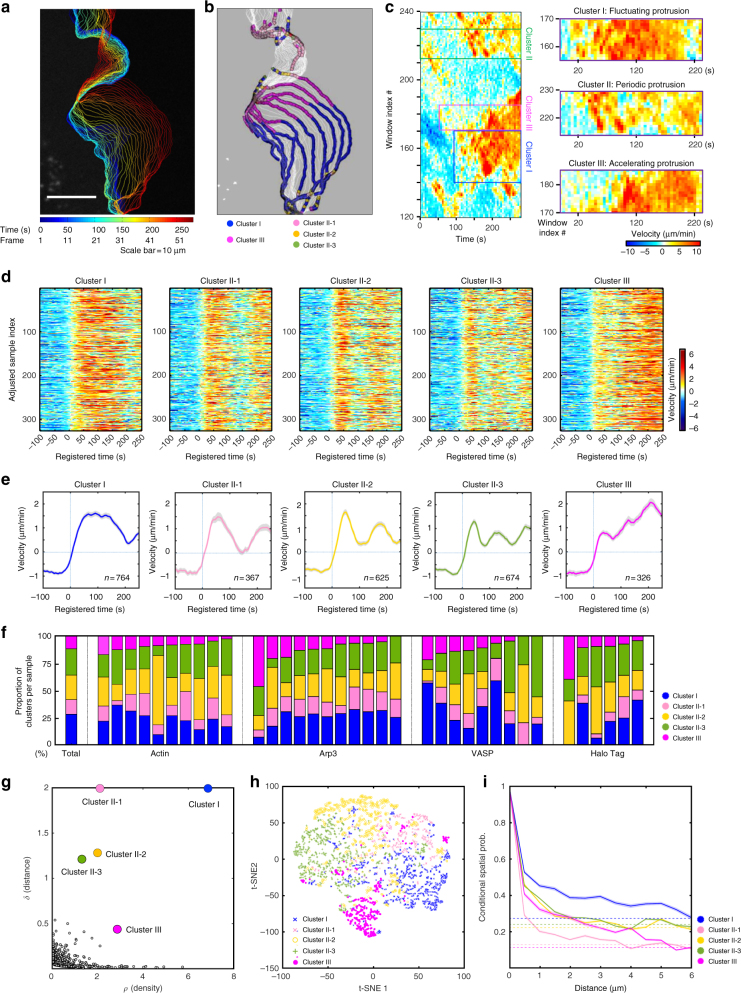
Fig. 2.
Subcellular protrusion phenotypes revealed by a time series clustering analysis. a–c A representative cluster assignment on a time-lapse movie of a PtK1 cell stained with CellMask DeepRed. Edge evolution on 5 s interval (a), cluster assignments of each probing window on every four frame (20 s interval) (b), and the space-time maps of instantaneous edge velocity (c) of the entire cell edge and the indicated cluster regions. Scale bar: 10 μm. d Raw velocity maps for Cluster I, II-1, II-2, II-3, and III. All time series are registered with respect to protrusion onset (t = 0). e Average time series of protrusion velocity registered at protrusion onsets (t = 0) in each cluster. Solid lines indicate population averages. Shaded error bands indicate 95% confidence intervals of the mean computed by bootstrap sampling. n indicates the number of time series in each cluster. The time lapse movies of 36 cells were used in this analysis. f Proportions of each cluster in entire samples or individual cells expressing fluorescent actin, Arp3, VASP, and HaloTag, respectively. g Decision graph of the density peak clustering analysis of protrusion velocities. h A t-SNE plot of the autocorrelation functions of protrusion velocity time series overlaid with cluster assignments. i Spatial conditional distribution of each cluster. Solid lines indicate population averages. Shaded error bands indicate 95% confidence intervals of the mean computed by bootstrap sampling

