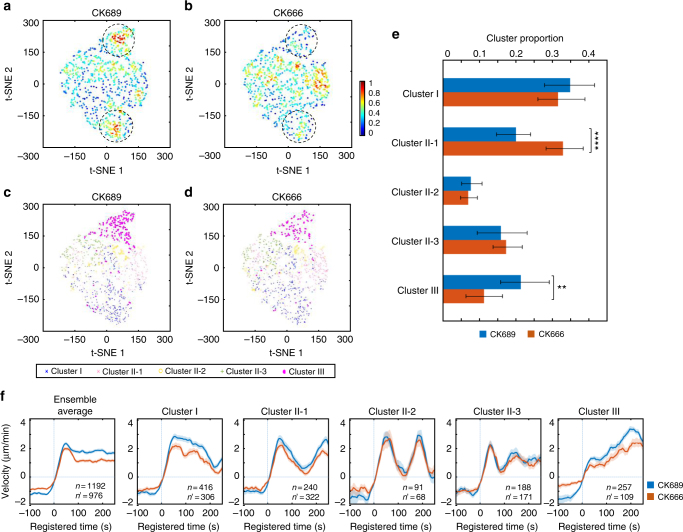
Fig. 5.
Functional validation by pharmacological perturbation of Arp2/3. a–d t-SNE plots of autocorrelation functions of protrusion velocity time series overlaid with the density of data (a, b) and cluster assignments (c, d). e Comparison of the proportion of each cluster between CK689 (50 μM, inactive control compound) and CK666 (50 μM). The error bars indicate 95% confidence interval of the mean of the cluster proportions. **p < 0.01 and ****p < 0.0001 indicate the statistical significance by bootstrap sampling. f Ensemble averaged velocity time series of entire samples and averaged velocity time series sampled in each cluster in CK689 or CK666-treated cells. All time series are registered with respect to protrusion onset (t = 0). Solid lines indicate population averages. Shaded error bands indicate 95% confidence intervals of the mean computed by bootstrap sampling. n and n' indicate the number of time series sampled in each cluster for CK689 and CK666, respectively. The numbers of cells used in the analysis are both 10 (CK689 and CK666)

