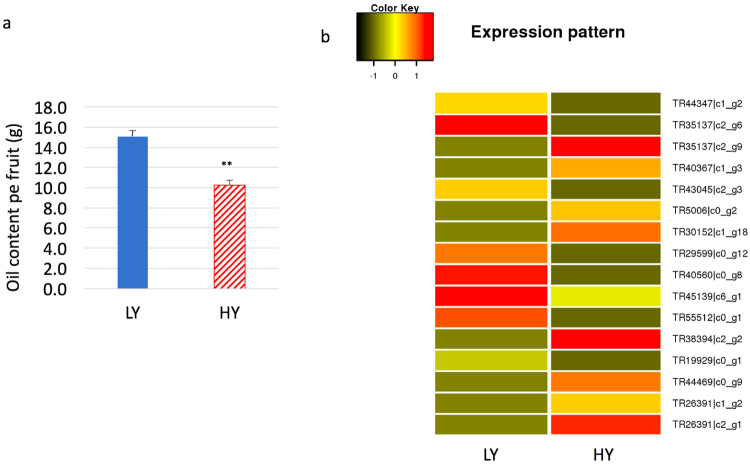
Figure 5.
Oil yield and expression levels of transcription factors and regulators among the DEGs. Image a shows the oil yield per fruit. Bars represent the mean value plus error, which was calculated from 10–20 fruits per tree per year with weight normalization relative to HY. Image b shows the expression levels of transcription factors and regulators. LY and HY represent low yield and high yield of fruits in C. chekiangoleosa. The name to the right of each line represents the ID of the differentially expressed unigene.

