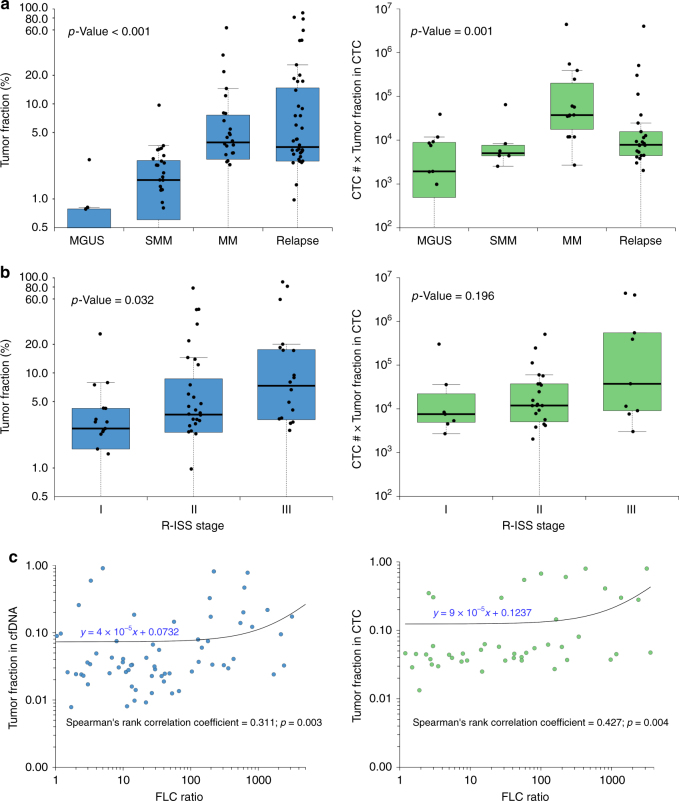
Fig. 2.
Clinical correlation of CTCs and cfDNA in multiple myeloma. The distributions of tumor fraction (%) in each group are shown as boxplots, where the central rectangle spans the first to the third quartile (interquartile range or IQR). A segment inside the rectangle shows the median, and whiskers above and below the box show the value 1.5 IQR above or below the third or the first quartile, respectively. a Tumor fractions of cfDNA samples (blue) and CTC number × tumor fractions of CTC samples (green) correlate with clinical stage of MM patients. The comparisons of the tumor fraction in cfDNA and CTC among different disease status (MGUS, SMM, newly diagnosed MM, and relapse) were performed by using Kruskal–Wallis test (p-value < 0.001 for cfDNA; p-value = 0.001 for CTC). b Tumor fractions of cfDNA samples (blue) correlate with ISS stage of MM patients, while CTC numbers × tumor fractions of CTC samples (green) do not. The comparisons of the tumor fraction in cfDNA and CTC among different R-ISS stages were performed by using Kruskal–Wallis test (p-value = 0.032 for cfDNA; p-value = 0.196 for CTC). c Tumor fractions of cfDNA (blue) and CTC counts (green: number of CD138-selected cells × tumor fractions in CD138-selected pools) in samples correlate with FLC ratio of MM patients. The correlations between the tumor fraction in cfDNA/CTC and serum free light chain ratio were analyzed by Spearman’s rank correlation test (Spearman correlation coefficient = 0.311 and p-value = 0.003 for cfDNA; Spearman correlation coefficient = 0.427 and p-value = 0.004 for CTC)

