Fig. 5.
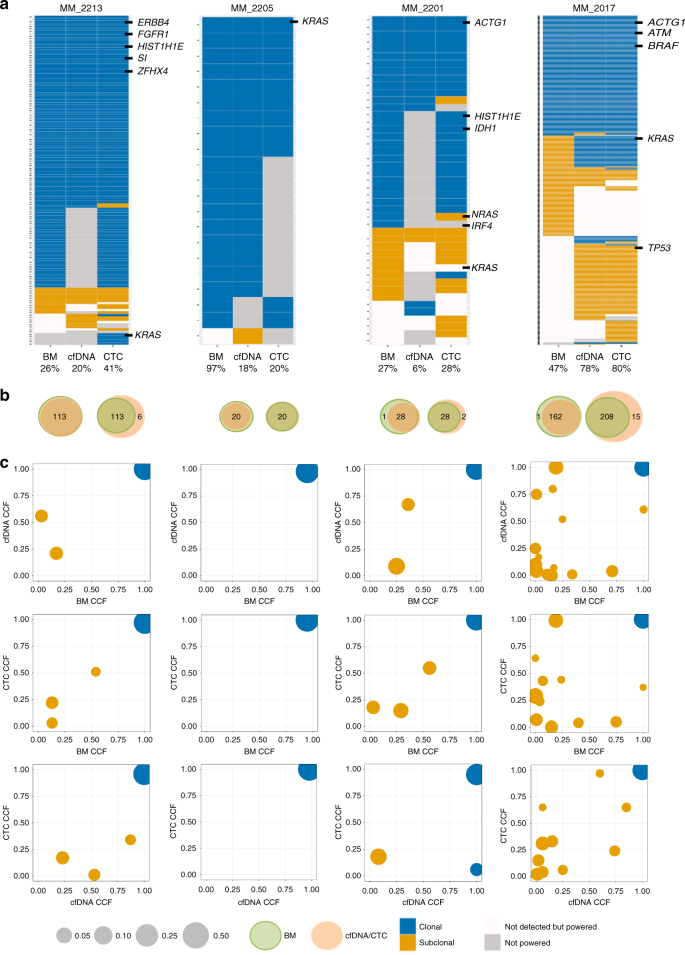
Whole-exome sequencing of matched cfDNA, CTCs, and BM tumor samples. a Presence of clonal (navyblue) and subclonal (yellow) somatic mutations in BM, cfDNA, and CTC WES is shown. Snow color represents mutations that were not detected with ≥0.9 detection power and gray color represents mutation sites with <0.9 detection power. MM and actionable pan-cancer related genes and purity of each sample are indicated. b Left Venn diagram shows the number of clonal mutations that were present in bone marrow biopsies (green) and confirmed in either cfDNA or CTC samples (orange). Right Venn diagram shows the number of clonal mutations that were present in either cfDNA or CTC samples (orange) and confirmed in bone marrow biopsies (green). c Cancer cell fraction (CCF) for clusters of SSNVs detected in bone marrow, cfDNA, and CTC samples from the same MM patient. Mutations were clustered by CCF for each pair of samples using PHYLOGIC. Clonal (navyblue) SSNVs were defined as events having ≥0.9 CCF in both samples. Subclonal (yellow) SSNVs were defined as events having <0.9 CCF in samples. Size of circles indicated the fraction of SSNVs. Mutations having ≥0.9 detection power in both samples are shown and clusters with <3 mutations are excluded

