
Fig. 6.
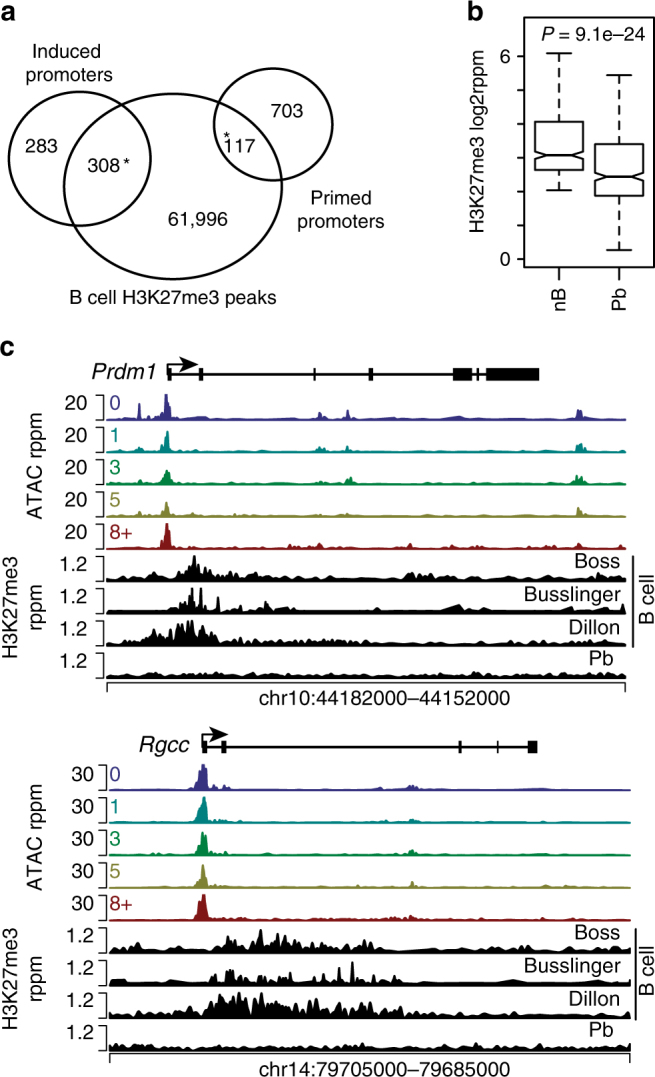
H3K27me3 marks a subset of primed-accessible promoters. a Venn diagram displaying the overlap of regions enriched for H3K27me3 in B cells with primed and induced accessible promoters. A significant overlap with a *P-value < 1e−5 as determined by Fisher’s exact test. b Box plot showing a comparison of H3K27me3 enrichment at primed-accessible promoters in B cells versus splenic plasmablasts. Boxplot center line indicates data median, lower and upper bounds of boxes the 1st and 3rd quartile ranges, and whiskers the upper and lower ranges of the data. Significance was determined by a two-tailed Student’s T-test. c Promoter accessibility across all divisions and H3K27me3 enrichment in B cells and plasmablasts are displayed for two example loci. H3K27me3 ChIP-seq data was an average of two biological replicates from both B cells and plasmablasts