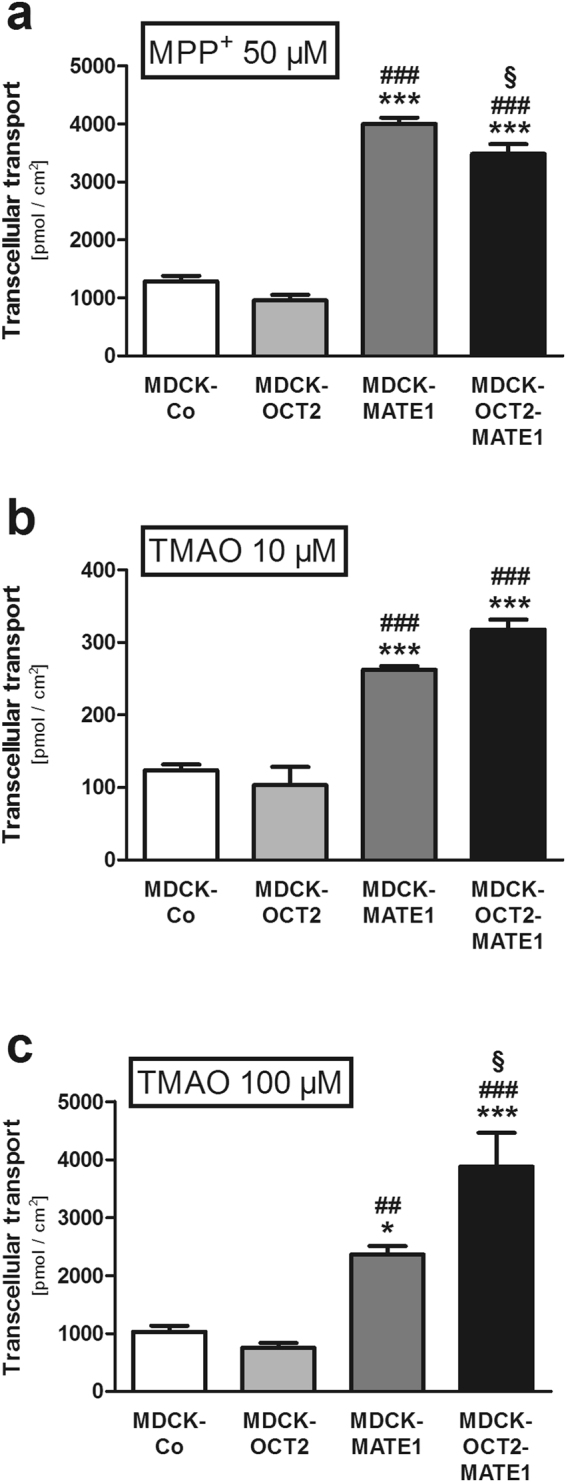
Figure 2.

Transcellular transport of MPP+ and TMAO [MPP+ (50 µM) (a), TMAO (10 µM) (b), and TMAO (100 µM) (c)] across polarised grown monolayers of MDCK cells expressing OCT2 (MDCK-OCT2), MATE1 (MDCK-MATE1), or both OCT2 and MATE1 (MDCK-OCT2-MATE1) and control cells (MDCK-Co) after 60 min. Each data point is 2 × n = 3, mean ± SEM, *p < 0.05 vs. MDCK-Co, ***p < 0.001 vs. MDCK-Co, ##p < 0.01 vs. MDCK-OCT2, ###p < 0.001 vs. MDCK-OCT2, §p < 0.05 vs. MDCK-MATE1.
