Figure 1.
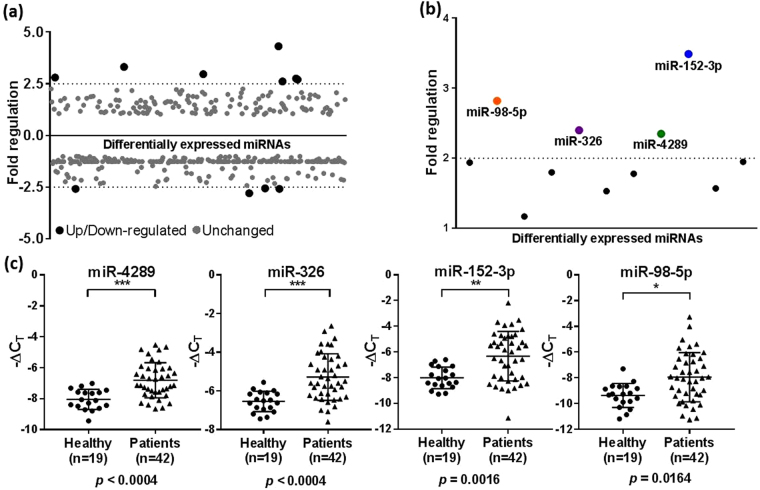
Screening of plasma miRNA markers in pooled patient and control samples and validation in the discovery cohort. (a) Scatter plot of 372 cancer-associated miRNAs in a screening cohort of pooled plasma samples from prostate cancer patients and healthy controls screened using a miScript miRNA PCR array. miRNAs found to be differentially expressed between the patient and control groups are shown in black, and unchanged miRNAs are shown in grey. A fold regulation cut-off of 2.5 was selected for the analysis. (b) Scatter plot showing the 11 differentially regulated miRNAs re-analysed by qRT-PCR in patient samples in the discovery cohort (N = 61). The mean fold regulation of each miRNA across the patient and control samples was taken into account and those that were below the 2 fold regulation cut-off were excluded from further analysis. The selected miRNAs are shown in colour. (c) Relative levels of miR-4289, miR-326, miR-152-3p and miR-98-5p analysed by qRT-PCR as in (b) in patients vs healthy controls. Statistically significant differences were assessed using a Mann-Whitney U test; p values are shown after Bonferroni correction for multiple testing. Each data point represents a plasma sample, the horizontal middle line in each data set represents the mean, and the limits of the vertical lines represent the standard deviation.

