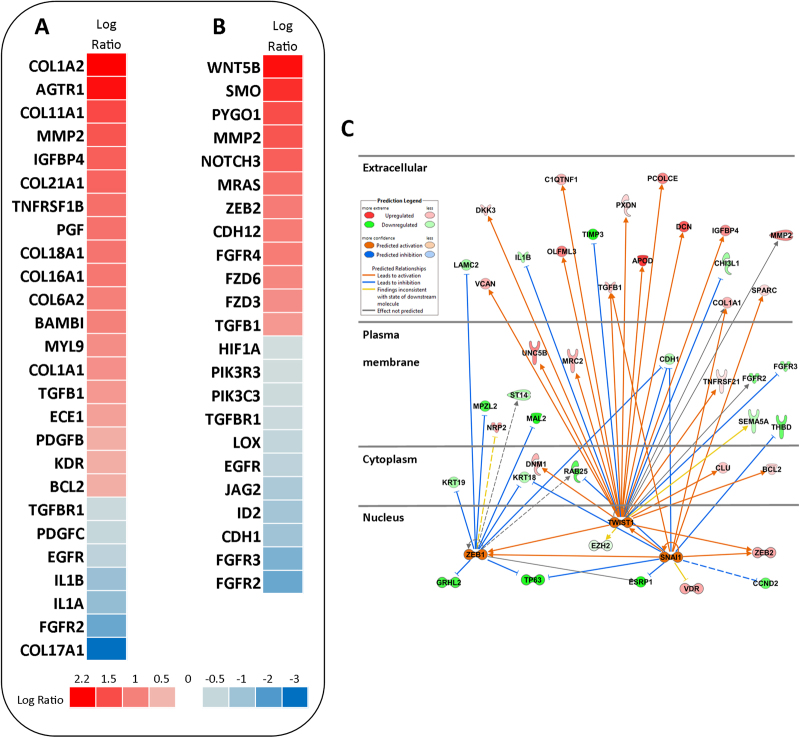
Figure 3.
RNA-Seq analysis following long-term exposure to AgNPs. BEAS-2B cells were exposed for 6 weeks to AgNPs at 1 µg/mL and RNA-seq was performed on triplicate samples. Using the IPA tool, pathway analysis of the DEGs was conducted. Heatmaps displaying the gene expression changes in the Ag10 vs Control samples were generated for the hepatic fibrosis pathway (A) and regulation epithelial-mesenchymal transition pathway (B). (C) Upstream regulator analysis was performed using the IPA software tool for Ag10 and a network was generated for the predicted activated transcription factors, ZEB1, TWIST1, SNAI1.

