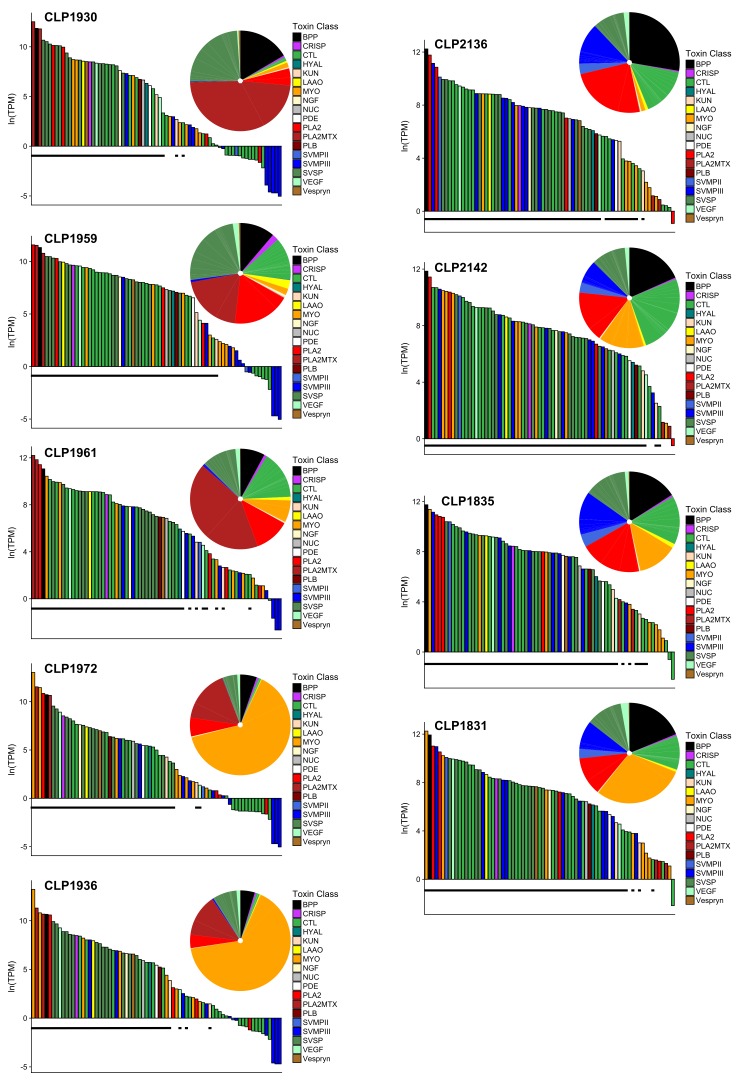
Figure 3.
Representation of the toxins in the venom gland transcriptome for nine C. scutulatus specimens. Type A are on the left and type B are on the right, and are ranked by the increasing amount of myotoxins. The bar graphs represent each of the 75 toxins identified. Any toxin that does not have a black bar under it did not meet the criteria for presence in the transcriptome. The pie charts represent the proportion of each toxin family in the venom gland transcriptome.

