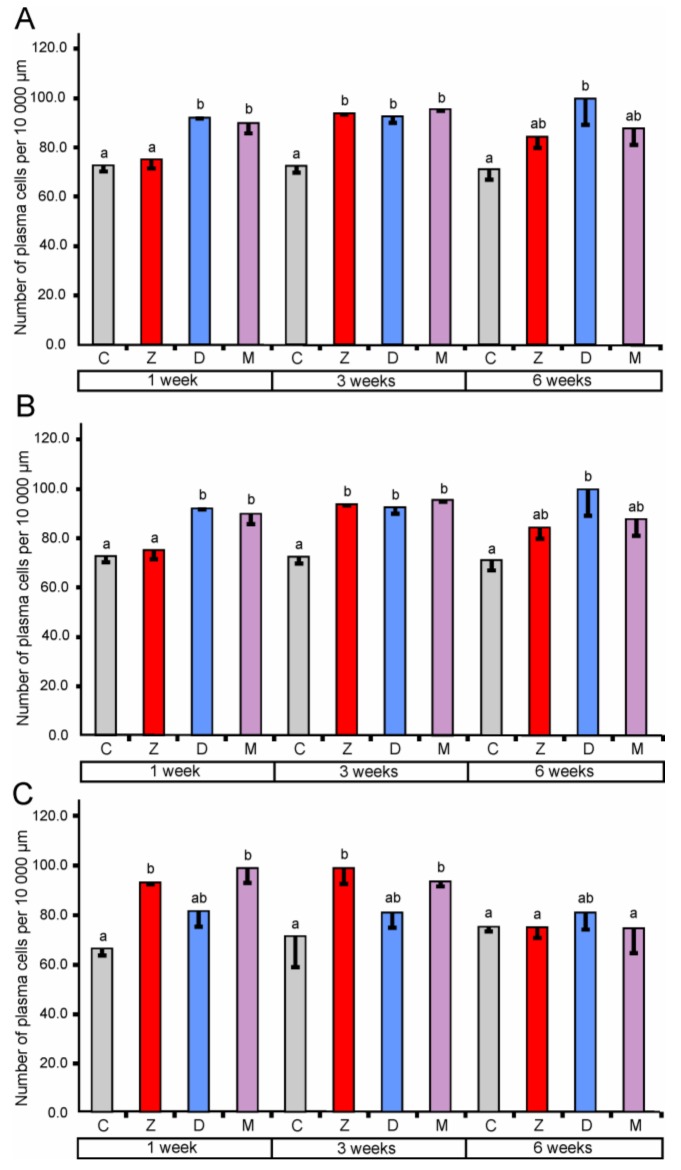
Figure 4.
Number of plasma cells per 10,000 µm in the lamina propria of the cecum (A), the ascending colon (B), and the descending colon (C). Values presented are the means and SEM. Means annotated with different lower case letters above the bars are significantly different at p ≤ 0.05. For other explanations, see Figure 1.

