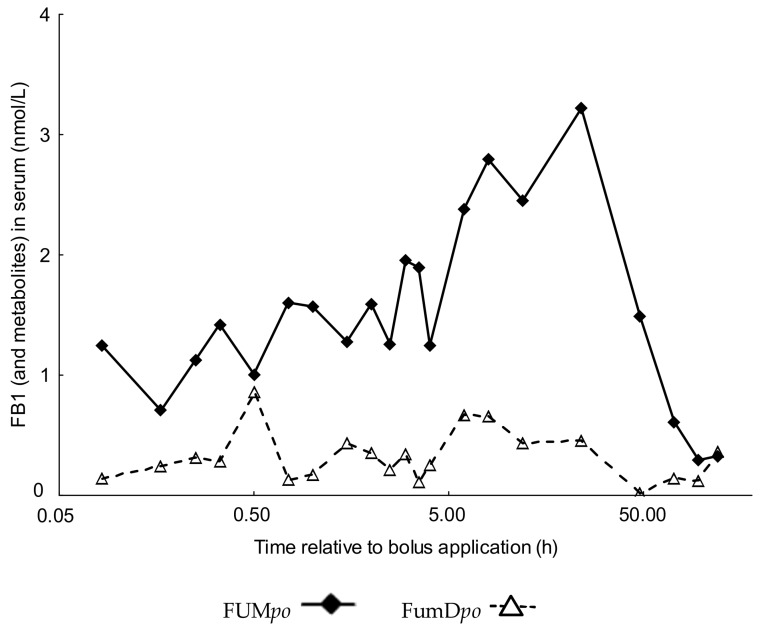
Figure 2.
FB1 and metabolites toxicokinetics in po treated pigs with or without fumonisin esterase (+/−FumD). Plot of serum mean concentrations (nmol/L; y-axis) of FB1 and metabolites (HFB1, pHFB1a and pHFB1b) and time (x-axis; semi-logarithmic plot) as means of the particular groups (n = 6/group). Pigs were randomly allocated to the different groups and treated as follows: FUMpo: 120 mg FB1 + 48 mg FB2 + 14 mg FB3/kg feed or FumDpo: 120 mg FB1 + 48 mg FB2 + 14 mg FB3/kg feed + 240 U FumD/kg feed. Frequent serum samples were taken over a period of 120 h post toxin application.

