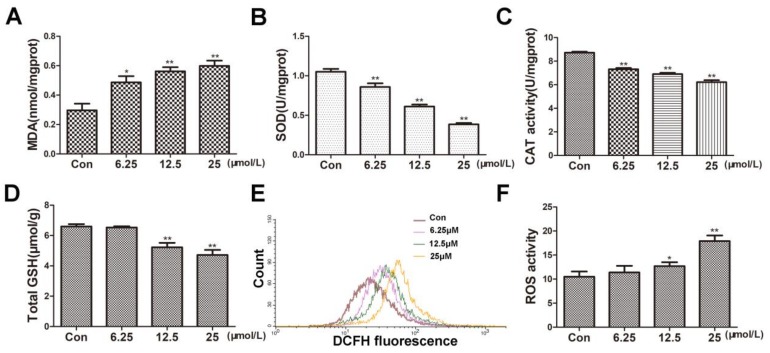
Figure 2.
BVC increased MDA and ROS but decreased the levels of SOD, CAT, total GSH after 24 h exposure. (A) MDA content was measured as described before after BVC incubation. (B) SOD levels were detected as before. (C) CAT level changes are shown. (D) Levels of total GSH in HepaRG cells after BVC incubation are shown. (E) Intracellular formation of ROS after incubation with BVC in HepaRG cells in the DCF assay is shown. (F) Quantitative analysis of the ROS is shown. Compared with control: * p < 0.05 and ** p < 0.01.

