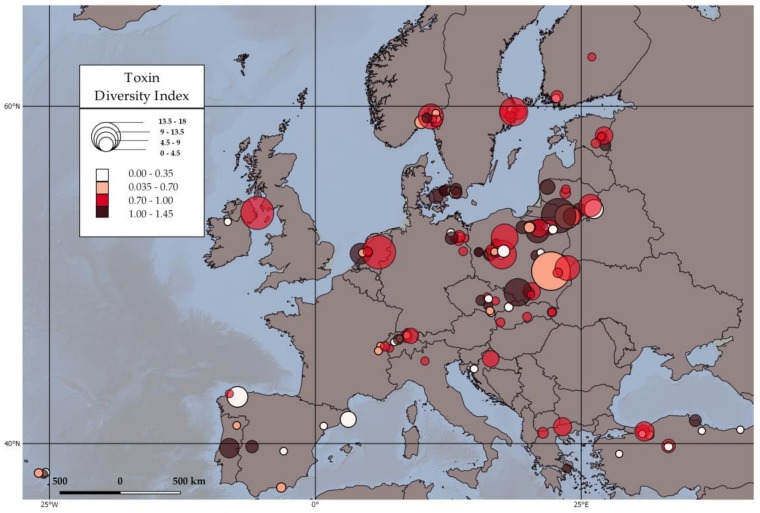
Figure 3.
Map of the Toxin Diversity Index (TDI) of the 137 EMLS lakes, calculated using the Shannon equation. TDI is categorized in four classes with higher colour density (red) representing higher toxin diversity and lower colour density (white) lower toxin diversity. The radius of the markers corresponds to the total toxin concentration in μg/L.

