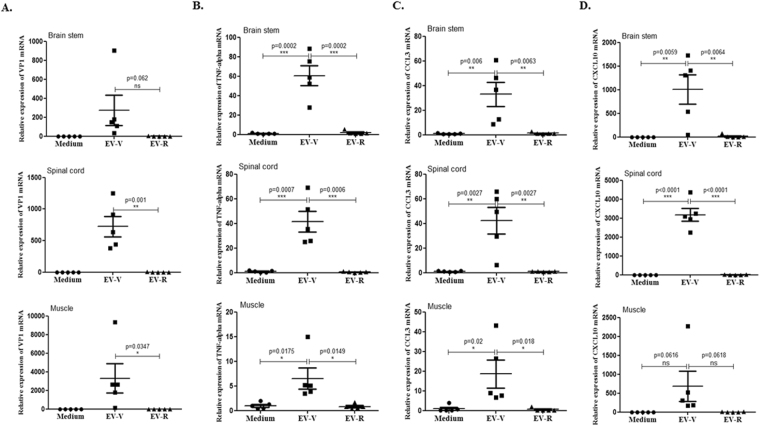
Figure 3.
Expression of VP1 and proinflammatory cytokines in the tissues of EV71-infected Tg-mice. Four days afterchallenginghSCARB2-Tg mice with 5 × 10⁶ pfu of EV-V or EV-R s.c., RNA was extracted from the brainstem, spinal cord, and muscle, and quantitative RT-PCR analysis was conducted to quantify (A) VP1, (B) TNF-α, (C)CCL3, and (D) CXCL10 expression. hSCARB2-Tg mice that received medium were used as the negative control. The number of PCR cycles required for fluorescent detection of target genes was calculated and is presented as the relative expression after normalization to the internal control of β-actin expression from the respective tissue as described in the Materials and Methods. A schematic representation of target gene expression and the statistical average from 5 mice per group are shown. One tail unpaired student’s t-test was used for statistical analysis.

