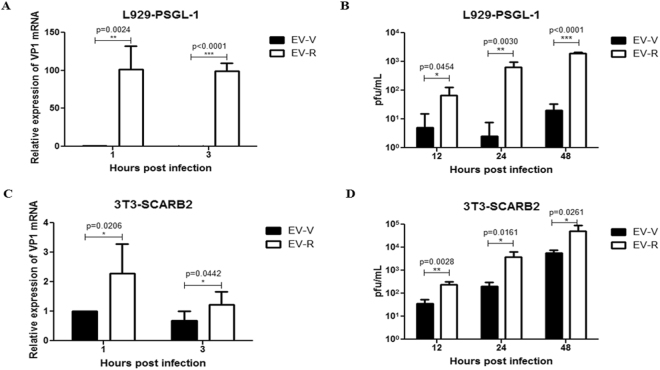
Figure 5.
Susceptibility of EV-R vs. EV-V in human receptor-expressing mouse cells. L929-PSGL-1 and NIH3T3-SCARB2 cells (4 × 10⁵ per well) were cultured in 6-well plates overnight and subsequently infected separately with EV-R or EV-Vat an MOI = 0.1. Cells were washed after 1 hour of infection and cultured for another 1 or 3 hrs for viral RNA extraction or 12, 24, or 48 hrs for a plaque-forming assay. (A,C) RNA was extracted from EV71-infected (A) L929-PSGL-1 or (C) 3T3-SCARB2 cells and subjected to quantification of EV71 transcripts with real-time RT-PCR using specific primers against the VP1 region and β-actin. The relative expression of the target gene was calculated as described in the Materials and Methods. Each VP1 2Ct value was normalized by calculating the ratio to the respective β-actin 2Ct value, and then the means of normalized 2Ct values were calculated. A schematic representation of the expression ofEV71 transcripts is shown. (B,D) The supernatants from EV71-infected (B) L929-PSGL-1 or (D) 3T3-SCARB2 cells were harvested and used to assay for viral titre with a plaque-forming assay as described in the Materials and Methods. Data represent one of three independent experiments. One tail unpaired student’s t-test was used for statistical analysis.

