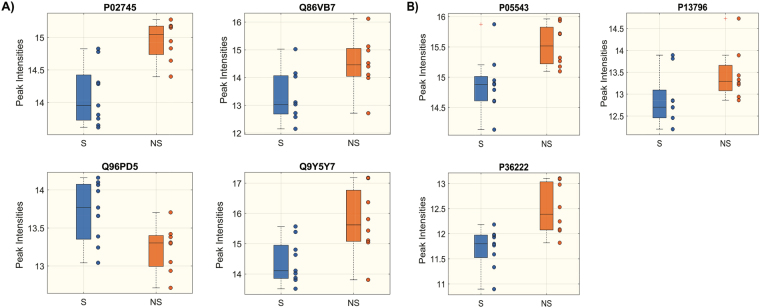
Figure 1.
Boxplot of protein peak intensities significantly different between S (blue) and NS (orange) at D1 (A) and D7 (B) (Wilcoxon rank-sum test p < 0.05, FDR <0.15). Distribution of differences is shown as box-plot. Each plot represents a different protein: P02745, Complement C1-q subcomponent subunit A; Q86VB7, Scavenger receptor cysteine-rich type 1 protein M130; Q96PD5, N-acetylmuramoyl-L-alanine amidase; Q9Y5Y7, Lymphatic vessel endothelial hyaluronic acid receptor 1; P05543, Thyroxine-binding globulin; P13796, Recombinase Flp protein; P36222, Chitinase-3-like protein 1.

