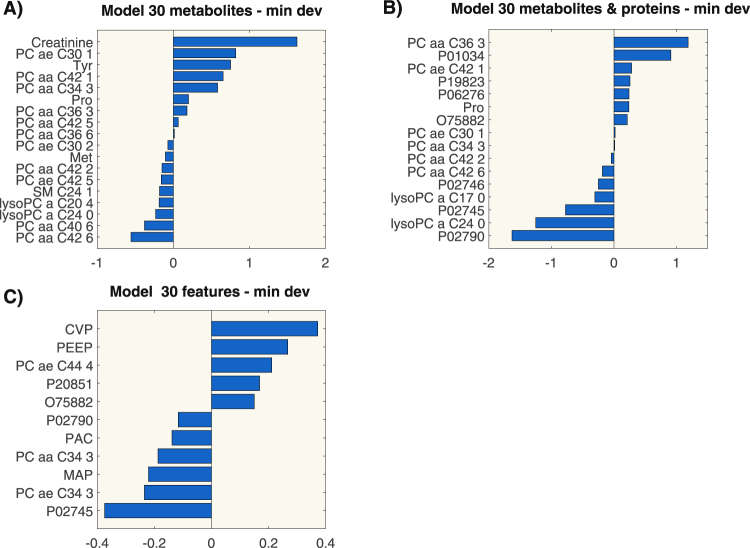
Figure 4.
Coefficient values of the logistic regression models built according to the criterion of minimal deviance on the first 30 ranked features. Each panel represents a regression model built on metabolomics data only (panel A), metabolomics and proteomics data (panel B) and on omics data and clinical parameters (panel C). Acronyms: P01034, Cystatin-C; P19823, Inter-alpha-trypsin inhibitor heavy chain H2; P06276, Cholinesterase; O75822, Attractin; P02746, Complement C1q subcomponent subunit B; P02745, Complement C1q subcomponent subunit A; P02790, Hemopexin; P20851, C4b-binding protein beta chain; CVP: Central Venous Pressure; PEEP: Positive End-expiratory pressure; PAC: PaCO2; MAP: Mean Arterial Pressure.

