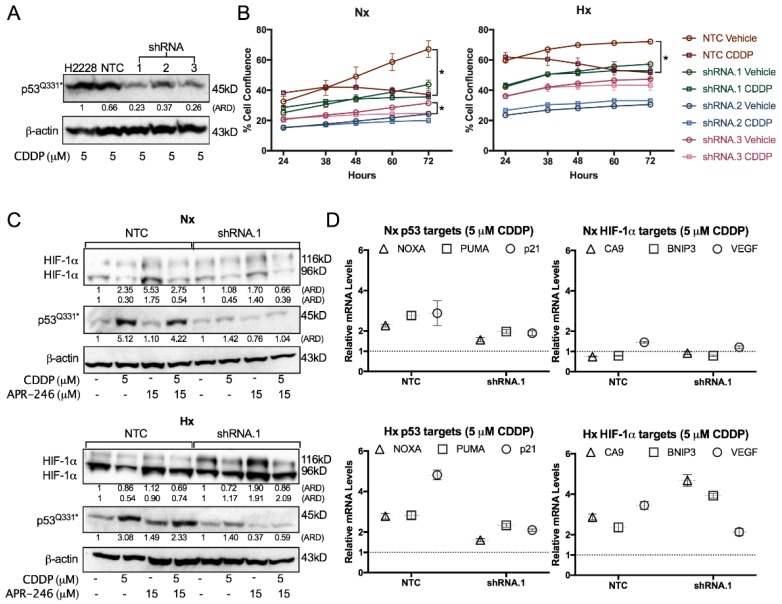
Figure 4.
Role of p53 in CDDP resistance. (A) P53 protein levels determined by Western blotting after 48 h treatment with 5 µM CDDP of the NCI-H2228Q331* parental cell line, nontemplate control (NTC), and three TP53 shRNA monoclonal subclones under normoxia. β-actin was used as an internal standard. (B) Cell proliferation presented as mean ± SD of 3 replicates Green Object Confluence using the IncuCyte system. Cells were treated with either vehicle or 5 µM CDDP under normoxia or 1% O2. (C) Protein levels of HIF-1α 116 kDa (processed), HIF-1α 96 kDa (unprocessed), and p53 were determined by Western blotting after treatment with vehicle, CDDP, APR-246, or combination therapy for 24 h in NTC and shRNA.1 (TP53 shRNA) cell lines under normoxic and hypoxic conditions. β-actin was used as internal control. (D) mRNA levels of p53 (NOXA, PUMA, p21) and HIF-1α (CA9, BNIP3, VEGF) transcription targets. NTC and shRNA.1 cells were treated with 5 µM CDDP for 24 h under normoxia or 1% O2 and expression levels are presented relative to the vehicle-treated sample under normoxia. (* p < 0.05 compared to vehicle-treated sample at the 72 h time-point). ARD: Adjusted Relative Density; Nx: normoxia; Hx: hypoxia.

