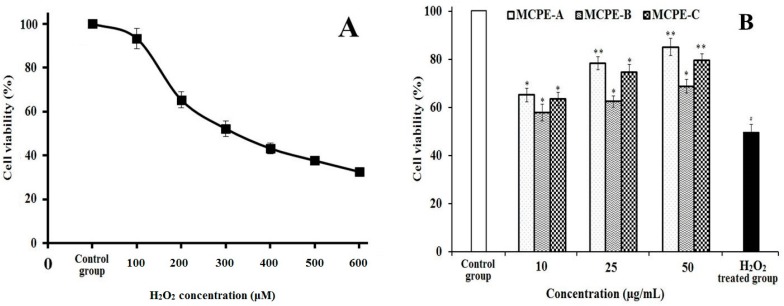
Figure 8.
Damage effect of H2O2 on HepG2 cells (A) and protective effects of MCPE-A, MCPE-B, and MCPE-C on H2O2-induced oxidative damage in HepG2 cells at concentrations of 10.0 µg/mL, 25.0 µg/mL, and 50 µg/mL, respectively; (B) All data are presented as the mean ± SD of triplicate results. # p < 0.05 vs. the control group. * p < 0.05 vs. the H2O2 treated group. ** p < 0.01 vs. the H2O2 treated group.

