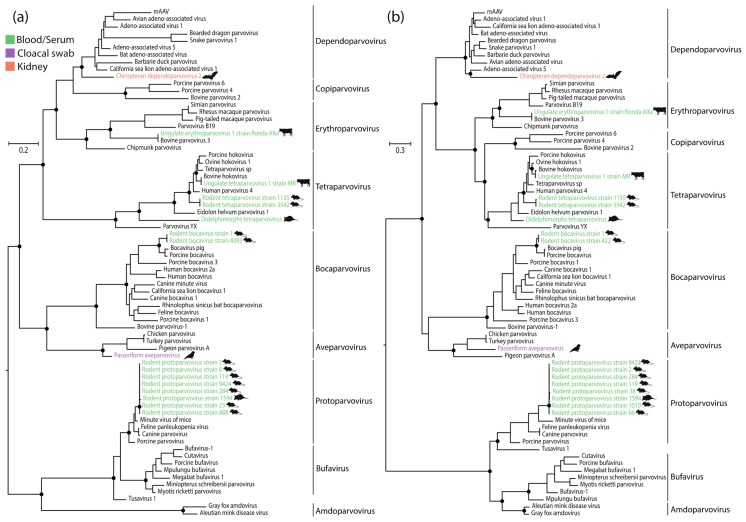
Figure 2.
Maximum likelihood (ML) phylogenies showing the evolutionary relationships of newly identified parvoviruses. (a) Phylogenetic tree of non-structural (NS) proteins; (b) Phylogenetic tree of viral proteins (VPs). Phylogenies are midpoint rooted for clarity of presentation. The scale bar indicates evolutionary distance in substitutions per amino acid site. Black lines indicate genera within the Parvovirinae subfamily. Black circles indicate nodes with maximum likelihood bootstrap support levels >75%, based on 1000 bootstrap replicates. Taxa names of parvoviruses identified in our study are coloured according to sample type, as shown in the key. Silhouettes indicate host species groups.

