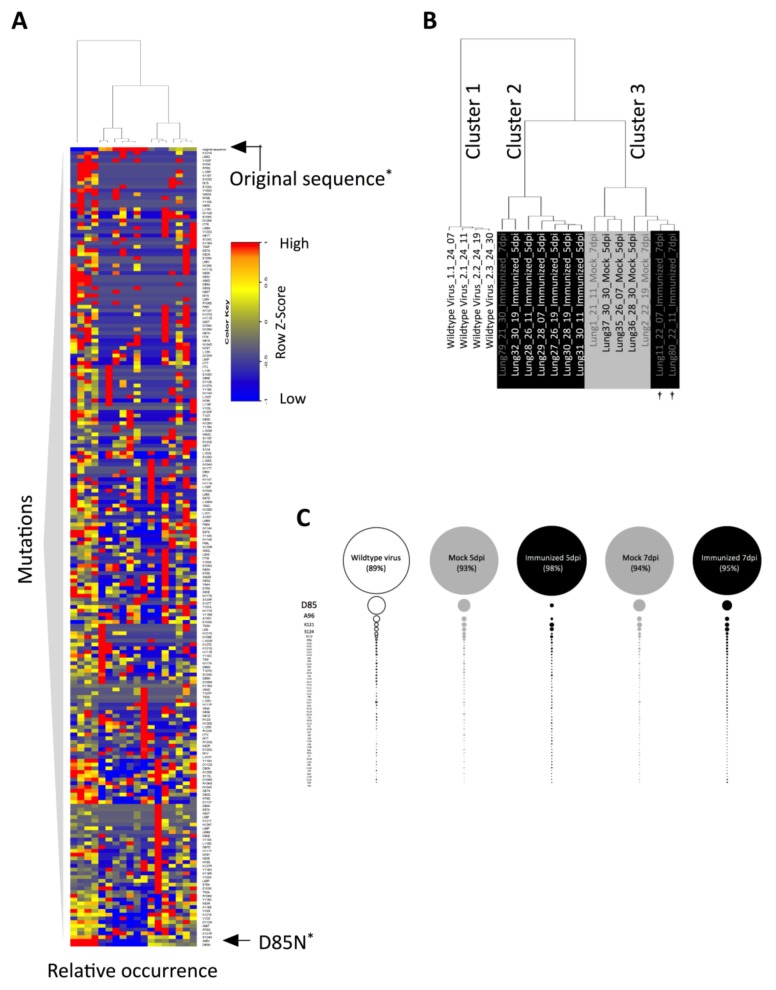
Figure 5.
Constrained viral quasispecies evolution under immune pressure. (A) Heatmap and dendrogram of missense mutations detected in at least three out of the 18 samples analyzed by Z score based on frequency. Values from each row (i.e., mutation) have been normalized to have a mean of 0 and SD of 1. Relative expression levels of the same mutation within the individual mice are represented by the color code indicated. (B) Enlarged dendrogram from (A) using hierarchical clustering analysis performed by complete linkage and Euclidean distance measurement. †: corresponding to the samples with the same labeling in Figure 4A and Figure S2A; (C) Mean sequence composition of samples per group. The sizes of the bubbles are proportional to the mean percentage sample consensus sequences of each group. * p < 0.05. Error bars represent SEM.

