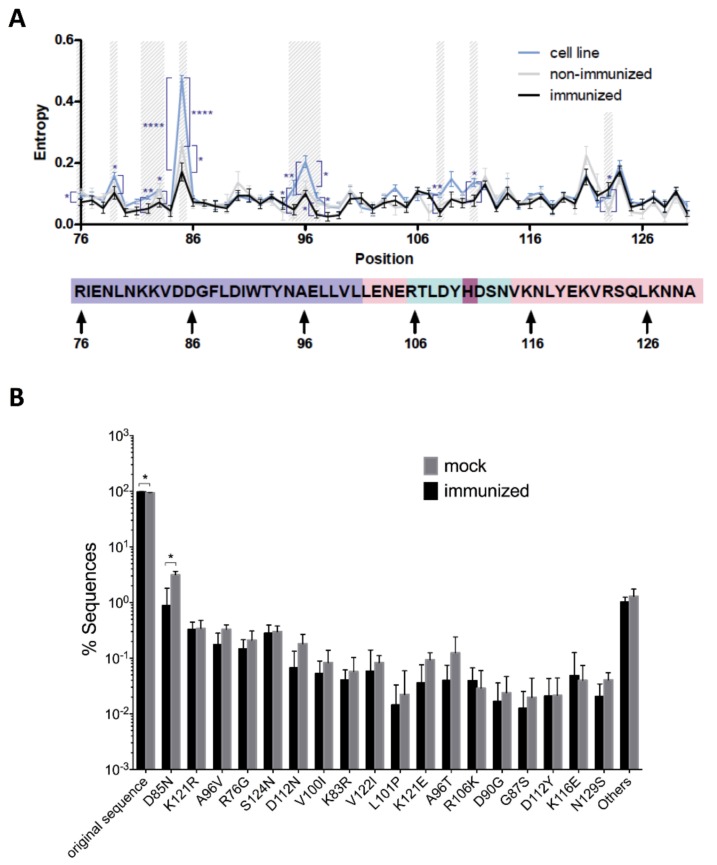
Figure 6.
Identification of variable amino acid positions. (A) Entropy at individual positions. Significant differences of mutation frequencies among groups are highlighted. * p < 0.05, ** p < 0.01, and **** p < 0.0001. p-values were calculated before the Benjamini and Hochberg correction. (B) Frequencies of top 18 mutations in Mock and Immunized groups. * p < 0.05 after the Benjamini and Hochberg correction. Error bars represent SEM.

