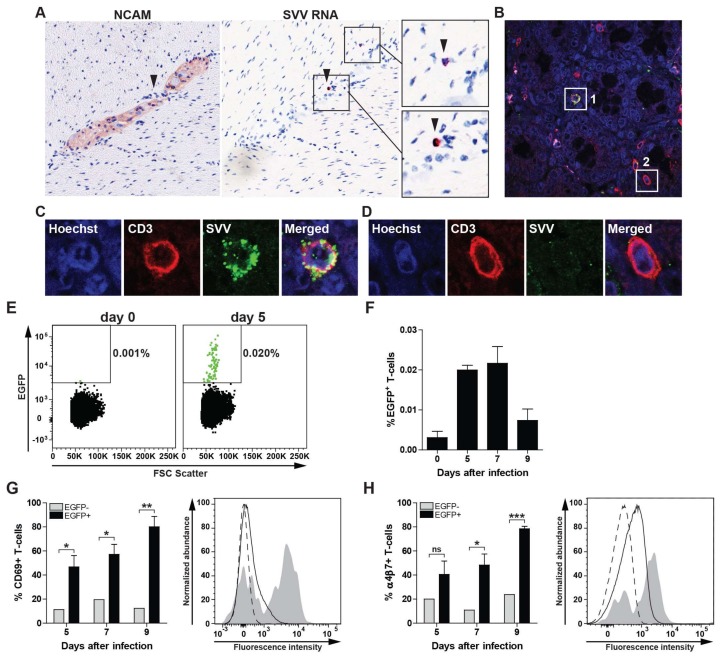
Figure 3.
Expression of CD69 and α4β7 integrin on SVV-infected T-cells during acute infection of African green monkeys. (A) Consecutive intestine sections from SVV-infected African green monkeys (AGM) at 9 days post infection (dpi) were stained for NCAM by IHC and SVV ORF63 by ISH. SVV-infected cells localized in close vicinity to enteric neurons in the absence of viral RNA expression in neurons. Magnification: 200×; Inset: 1000×. Arrowheads indicate same cell in adjacent sections; (B–D) Confocal microscopy image showing co-localization of SVV antigen (green) and CD3 (red) in intestine sections from SVV-infected AGM at 9 dpi. Nuclei were counterstained using Hoechst 33342 (blue). Magnification: 400×; (C,D) Show enlargements of white boxes indicated with #1 (example of SVV-infected T-cell) and #2 (uninfected T-cell). Two intestine paraffin blocks (each containing four distinct biopsies) from two AGM were analyzed. Number of ORF63 ISHP°S lymphocyte-like cells and SVV-infected T-cells ranged in numbers from scarce (AGM 294) to abundant (AGM 269). Representative images are shown for AGM 294 (A) and AGM 269 (B–D) [10]; (E,F) Peripheral blood mononuclear cells (PBMC) from a SVV.EGFP-infected AGM were analyzed for the presence of SVV-infected (EGFP+) CD3+ T-cells by flow cytometry; (E) Dot plots showing EGFP+ events (green) among 100,000 T-cells at 0 and 5 dpi for AGM 294; (F) Frequency of EGFP+ T-cells in three SVV.EGFP-infected AGM at 0, 5, 7 and 9 dpi; (G,H) CD69 (G) and α4β7 integrin (H) expression on SVV.EGFP-infected (EGFP+) and uninfected (EGFP−) CD3+ T-cells from three SVV.EGFP-infected AGM at 0, 5, 7 and 9 dpi. Histograms show the expression or CD69 (G) and α4β7 integrin (H) on uninfected (EGFP−, solid black line) or SVV-infected (EGFP+) PBMC (grey filled) of AGM 273 at 5 dpi [10]. Dashed black line indicates fluorescence minus one (FMO) control; (F–H) Data represent average ± SEM from 3 AGM. ns: not significant; * p <0.05, *** p < 0.001 by unpaired Student’s t-test.

