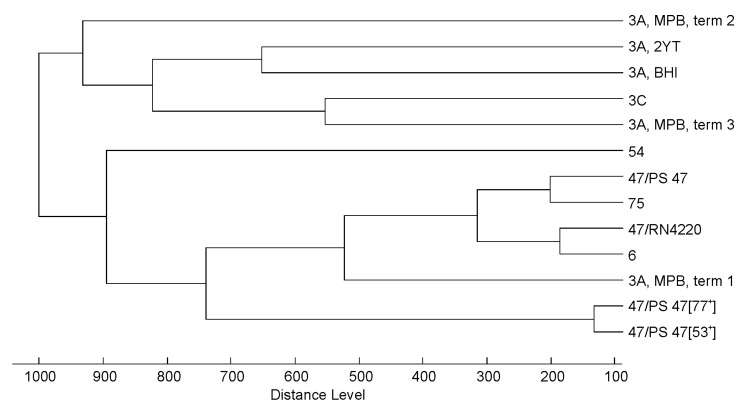
Figure 4.
Cluster analysis of Triavirus mass spectra demonstrating the influence of the mass spectral variability of the method itself (phage 3A, term 1, term 2, term 3), variability resulting from different propagation strains (phage 47 propagated on S. aureus RN4220, PS 47, PS 47 [53+] and PS 47 [77+]) and different cultivation media (phage 3A propagated in meat-peptone broth (MPB), brain heart infusion (BHI) and 2× yeast-tryptone broth (2YT).

