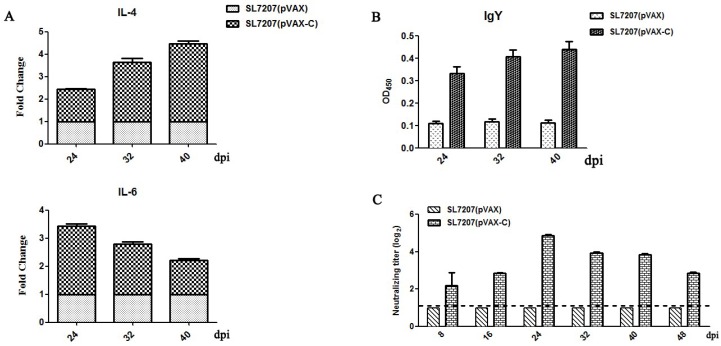
Figure 3.
Immune responses stimulated by the vaccine. (A) Expression of IL-4 and IL-6 was measured by quantitative real-time polymerase chain reaction (RT-PCR) to evaluate the cellular immune responses. Data from RT-PCR was analyzed using 2−ΔΔCt method. The expression level of IL-4 and IL-6 in the SL7207 (pVAX-C) vaccinated group was presented as changed fold reference to those in the SL7207 (pVAX) group. Data are shown as the mean ± standard deviations (n = 3 of each time point); (B) The specific antibody IgY in the serum against the DTMUV capsid protein was detected by using indirect ELISA. The serum samples were incubated with the capsid proteins and detected by using the horseradish peroxidase conjugated goat anti-bird IgY. OD450 value of each well was measured. The titers of the specific antibody were presented as the means ± standard deviations (n = 3 of each time point); (C) Neutralizing antibodies against DTMUV in the serum was detected by neutralizing assay. The titers of neutralizing antibodies against DTMUV were detected and presented as the log2 changed folds (Y-axis) reference to the negative control group SL7207 (pVAX). Data are shown as the means ± standard deviations (n = 3 of each time point). The dash line indicates the lowest threshold value for positive reaction in the neutralizing assay. All data were graphed by GraphPad Prism v5.0 (La Jolla, CA, USA).

